Accurate Measuring
Calibration of Measuring Devices
Calibration of measuring devices deals with one of the three sources of uncertainty: accuracy.
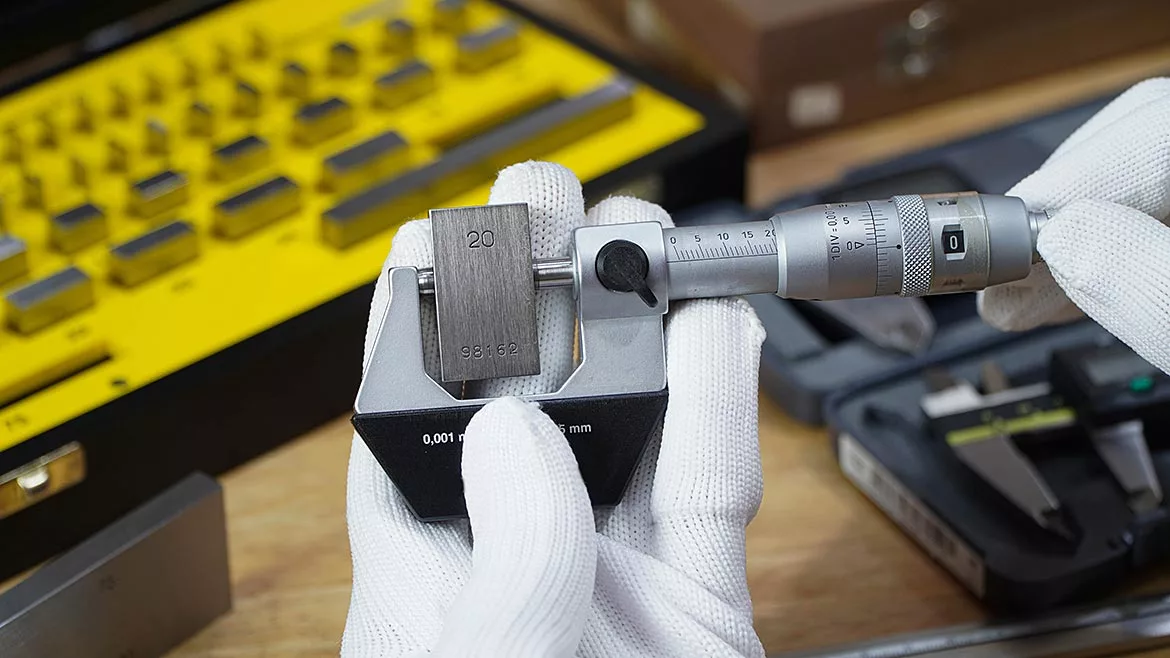
Image Source: Apicha Thumvisead / iStock / Getty Images Plus via Getty Image
Data-driven problem solving is critical for organizations to remain competitive; however, good decisions are built upon accurate measurements. A calibration schedule for instruments must be completed at the right time to ensure minimum bias, the evaluation of as-is condition gives light to serviceability and the adequacy of calibration efforts. This article highlights the use of linearity and bias studies to extract information on the accuracy of measurements, highlighting instruments that may need further investigation.
Measurement devices produce data used to ensure processes are in control and capable of meeting requirements. Measurements include uncertainty, which may interfere with good decision-making. Measurement uncertainty involve three components: accuracy, precision, and random variability. The use of the stopwatch function on a personal device provides a good illustration of each. The difference between the reading indicated and what could be determined with device known to produce robust results denotes the accuracy of the reading. Obtaining the same result with repeated tries or reproduction of the same result by multiple people is considered precision. Nothing can be done about the third component, random variability. Further study into precision involves measurement systems analysis, which is not part of this article and strongly suggested as a follow-up topic for readers. Calibration of measuring devices deals with one of the three sources of uncertainty: accuracy.
Calibration is most effective when the subject instrument is first studied in “as is” condition within the typical use environment (figure 1). The graph provides initial visual evidence of instrument accuracy. A sizeable amount of bias variation in the blue dots (observations) is present across the reference range. The red squares represent average bias, and the red line indicates that bias changes across the reference range. Comparison of the cloud of observations to the Bias (y-scale) explains that the device generally provides values that are greater than the actual measurement.
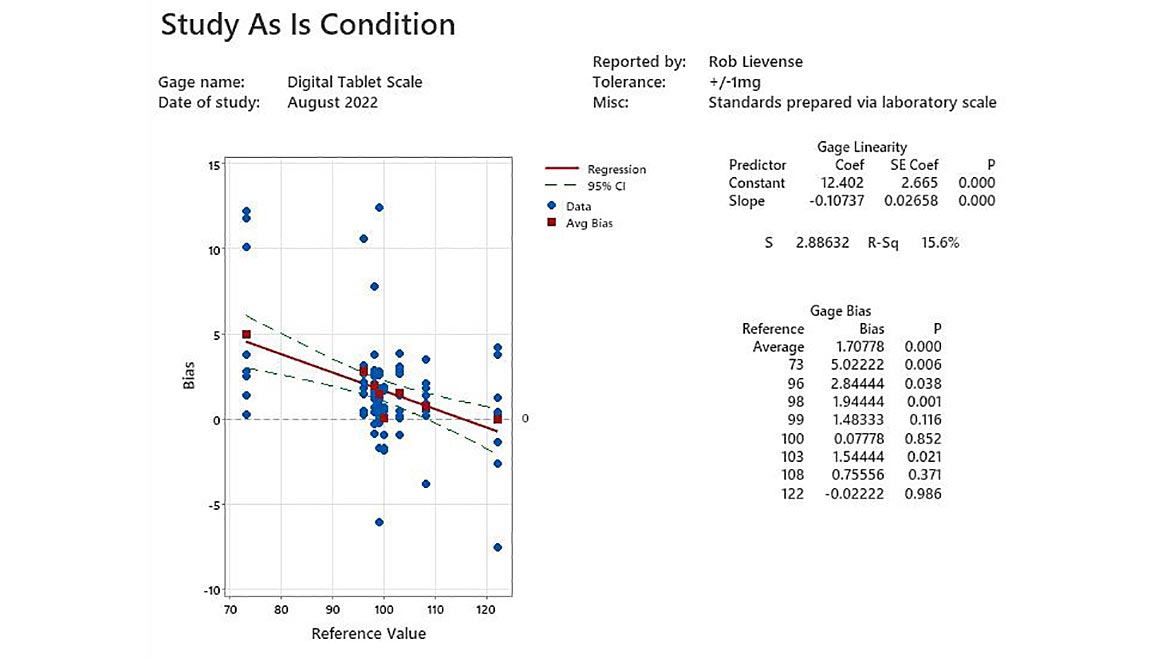
Figure 1 - Study As Is Condition | Image Source: Minitab LLC
Calibration is done to mitigate bias. Average bias is a summary of the differences in measurement across the reference range. The reference range should be wide enough to determine bias for measures that include out of specification results. A good rule of thumb is a reference range that is at least 125% beyond the specifications. A review of process history can be used to tune in the reference range through determination of the most extreme measures likely.
Consider a digital scale used in manufacturing operations to measure the weight of pharmaceutical tablets. Tablet weight is quantified in milligrams (mg) and the scale manufacturer specifies that the device can measure to within 1 mg. A laboratory scale is used to create the standard measurements as it is specified to measure to within 0.1mg. Measurement standards that are 10X tighter than the test device should work very well for a study. Some studies involve manufactured standards, which tend to be expensive and require specific storage and handling to ensure continued serviceability.
The tablet samples are stored in clearly marked small containers during the study to avoid inadvertent mixing. Great care and documentation must be involved to ensure that the samples cannot be released into the flow of good product. Technicians agree upon handling procedures to ensure that the test samples are not changed, which is critical to the value of the study. The example study includes replicate measurements of samples and multiple trials by three operators to represent typical use. The standards were created by measuring each sample three times and calculating the average. One could argue that some uncertainty from replication and reproduction is included in the data, which is not necessarily a bad thing.
Bias tends to not be constant across a range of measurements. Linearity is used to fit a linear model about the bias values. The averages in bias across the measurement range are used to calculate the intercept and slope of the trend (table 1). Statistical regression is used to test if the slope of the average bias trend is different than zero, which is the default expectation. A significant trend in bias does not necessarily condemn a device. Technicians must use the fit statistic (r-square) and subject matter expertise to determine if the trend is practically relevant to the needed accuracy when the device is applied. A significant trend of a building negative bias of 0.11mg for each unit increase in range is not practically relevant when measuring a specification range of 80 to 90mg.
Average bias can be a useful summary statistic to explain the accuracy of a gage; however, it becomes less useful when a significant linear trend is present. The p values across the reference range (table 2) indicate significant differences in bias, especially for tablets in the lighter half of the reference range. The lightest tablet (standard = 73mg) include bias in measurement that is nearly three times greater than the average bias with only a six tenths of a percent likelihood that the difference is due to random variability (p=0.006).
The digital scale is clearly not performing as accurately as the instrument’s technical specifications indicate. The problem is more severe if the instrument is used for tablets with a standard weight less than 99mg. The organizational requirement for digital scales used in operations is accuracy within 3mg. No further action is required per procedure; however, it may be prudent to investigate if the unit has been used for very light tablet product to ensure that an unacceptable quality risk is present.
The digital scale is serviced by calibration technicians and the internal load cell is adjusted per standard procedure to “zero” the unit. Many organizations stop at this point and release the unit back to regular use. It is prudent to replicate the study and determine the linearity and bias of the calibrated unit to illustrate the accuracy as used in operations.
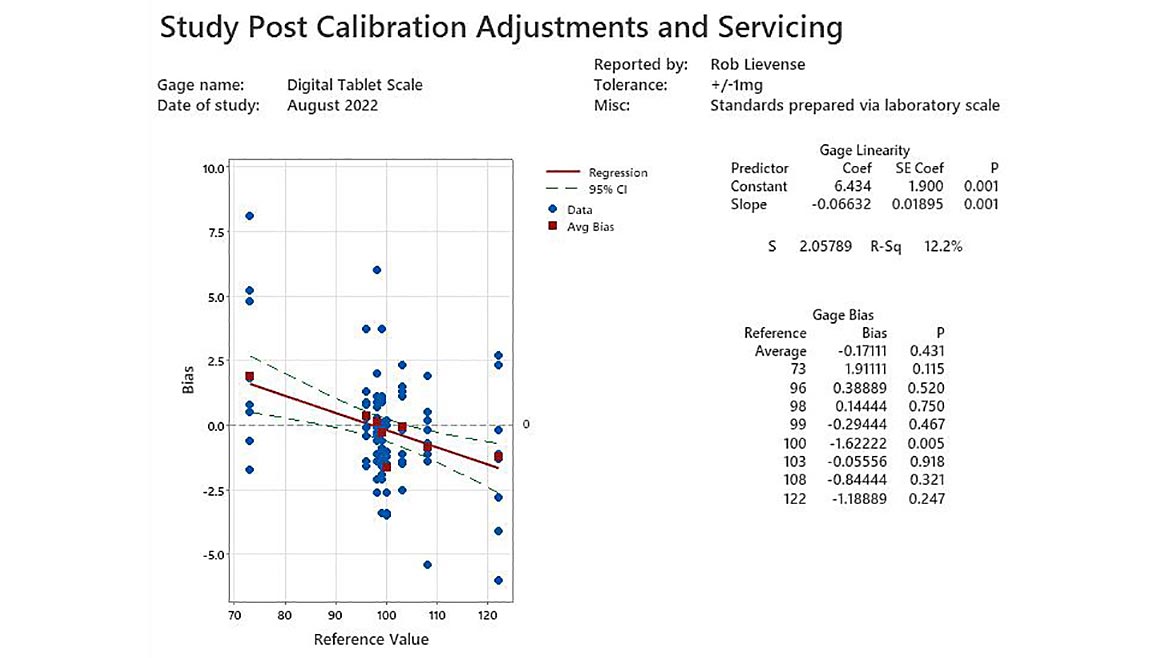
Figure 2 - Study Post Calibration Adjustments and Servicing | Image Source: Minitab LLC
The post calibration study (figure 2) illustrates that the digital scale has a much higher level of accuracy than before. Significant linearity exists with the instrument (P=0.001); however, it is not considered practically relevant to the weight specifications used during production. Average bias of (-0.2 mg) can be used to summarize the performance as only one reference weight has bias that differs significantly (100mg, bias of -1.6, p=0.005).
Linearity and bias studies provide a great deal of information about a measurement instrument. Tracking of results over time can help organizations determine if the calibration schedule is robust as well as suggesting possible handling problems. Well planned studies reduce quality risk by enhancing the reliability of values obtained during quality checks. Instruments that indicate increasing bias in as is studies should be considered for replacement to ensure high levels of accuracy across the organization.
Looking for a reprint of this article?
From high-res PDFs to custom plaques, order your copy today!


