Brain Teasers: Holes Too Tight

Anyone who has faced a production problem with a need to solve it by using production data can relate to the notion of a brain teaser. The brain teasers presented here are based on real-world situations encountered by workers in manufacturing environments. The brain teasers have three parts: (1) the situation, (2) available data or other supporting information, and (3) questions that various workers need answered for continual improvement. Recommended solutions follow in the next issue and on the Web at Quality Online (www.qualitymag.com).

Situation
Julie is the process engineer for supplier components and she communicates all production issues with the components to the specific supplier. Complaints from assembly about the diameter of holes in one component have captured her attention. Specifically, the hole diameters are too small and, out of approximately 20,000 pieces required each month, about 450 pieces are unusable. Julie has decided to send these pieces back to the supplier to emphasize the magnitude of the situation. She has calculated a defect rate of 22,500 PPM (parts per million) for this one component.Available Data
Data on hole diameter are not available from the supplier so Julie has asked the assembly engineers to collect data on the hole diameter for two units every two hours for three days. These data are summarized in the table, “Hole Diameter Data.”Questions
1. Based on the data collected by the assembly engineers, what is the process behavior of the hole diameter?2. What is the capability of the diameter of the hole for this component?
3. Is the current behavior consistent with the complaints from assembly and the presence of an average of 450 pieces per month with holes that have diameters too small?
4. What actions do you recommend that Julie take with the supplier to improve the problem with holes that are too small?
Answers to June Brain Teaser
To ensure that customers receive the quality product they specify, Rafael conducts a product qualification study on the critical characteristics every time a change is made in the product or process. Using a spreadsheet developed by his company, Rafael analyzes data for the product critical characteristics. For characteristics that meet the minimum Cpk of 1.33, the spreadsheet cell turns green; otherwise, the cell turns red. All characteristics with red cells must be investigated.
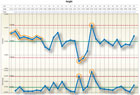
A: Perpendicularity has a predictable process behavior with an average of 0.068 and a standard deviation of 0.038. Height has an unpredictable process behavior with one long run of 8 and 3 points outside the limits on the individuals chart plus two moving ranges above the upper control limit on the moving range chart. See the individuals and moving range charts, “Perpendicularity” and “Height.”
Q: What is the capability of perpendicularity and height based on the analysis in the previous question?
A: Perpendicularity has a maximum specification of 0.022. The correct way to calculate the Cpk in this situation is to use the maximum as the upper specification. This gives Cpk = 1.33 which just meets the requirement of 1.33. See the chart, “Capability Analysis for Perpendicularity.”
Because height is unpredictable, calculations of capability are not appropriate. In such cases, an alternate to Cp and Cpk is to calculate Pp and Ppk using the overall standard deviation for height. For height the overall standard deviation is 0.01098 with Pp = 1.214 and Ppk = 1.213.
Q: Are the answers consistent with the results that Rafael obtained from his company’s spreadsheet?
A: No, these answers are not consistent with Rafael’s spreadsheet. His company’s spreadsheet gave a value of Cpk = 0.59 for perpendicularity, which is incorrect. This is the value obtained if zero is used as a lower specification. Because perpendicularity cannot be less than zero, the value of zero is a boundary and not a lower specification. The spreadsheet gave a value of Cpk = 1.67 which would be correct if height had a predictable behavior. However height is unpredictable and Cpk = 1.67 is not correct. Cpk uses a standard deviation based on the moving ranges which is unpredictable for height as well as an average based on the individual values which also are unpredictable for height.
Q: Can the use of the current spreadsheet results lead to problems with qualifying product?
A: As shown in these two situations with perpendicularity and height, the current spreadsheet does not account for boundaries with measurements nor does it make adjustments in the results for unpredictable behavior in the measurements. Therefore, this spreadsheet gives results that are incorrect or misleading for some characteristics. A correct analysis of the data in the spreadsheet would have given a “green” cell to perpendicularity rather than “red” and a “red” cell to height rather than “green.”
At a minimum such errors can lead to lost time rerunning qualification studies on characteristics that already meet the requirements as well as failing to notice requirements that have unpredictable behavior.
Looking for a reprint of this article?
From high-res PDFs to custom plaques, order your copy today!


