Gage R&R
Time to improve your process capability?
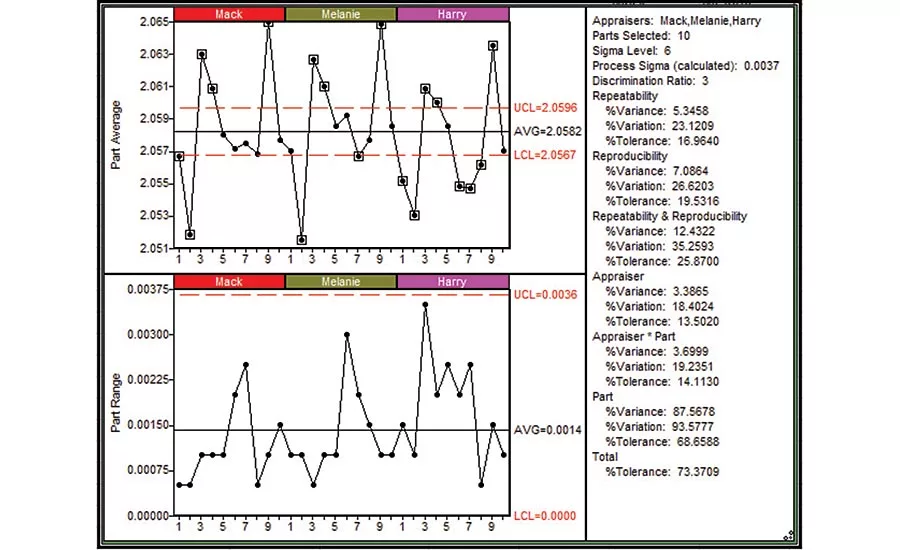
Figure 1. Figures from SPC IV Excel by Quality America. Used by permission
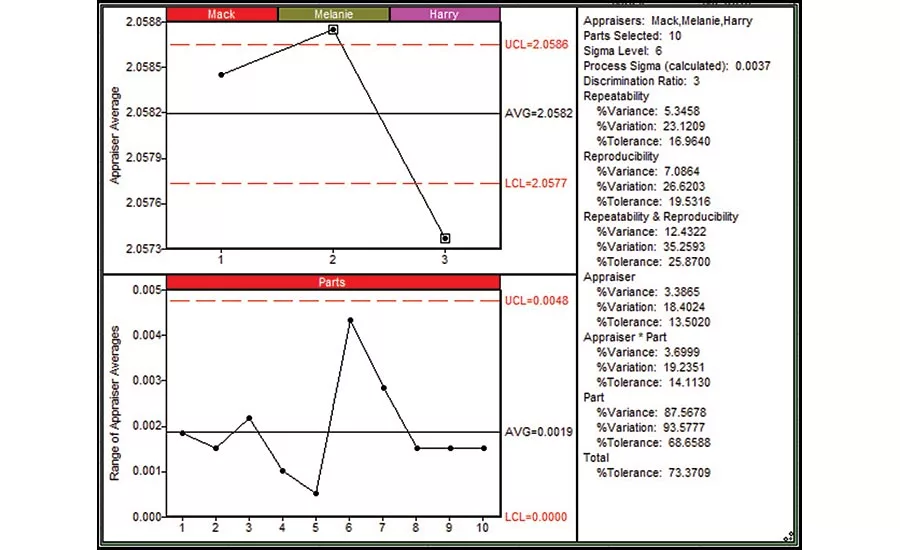
Figure 2.
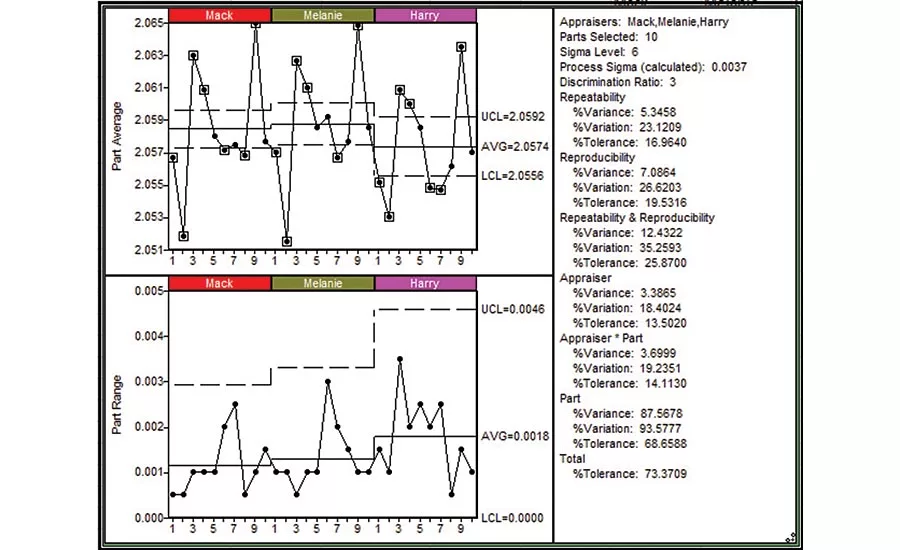
Figure 3.
Spending too much (time or money) on part disposition? Start with an analysis of your measurement system. Even a marginal measurement system could contribute up to 30% of the variation seen in your control chart. Reducing the measurement error to 10% could improve your capability index from a rather poor 1.0 to a more respectable 1.2 (for example). When processes have marginal capability, and measurement error is significant, you will scrap good parts and ship bad parts, even with 100% inspection.
In daily operations, we regularly use our measurement system to detect and isolate output unacceptable to our customers. If we are serious about quality, we recognize Deming’s argument that only processes in statistical control are predictable; otherwise, we are often forced into 100% inspection of the process to ensure output meets requirements. The statistical control of the process forms the basis of process capability analysis. (See also: Is your Process Performing, Quality Magazine; June 27, 2011).
Yet, too often we assume the measurements underlying product disposition and the process control charts/capability analysis are absolute. Unfortunately, they’re not! Measurement error comes in many forms. Accuracy error due to calibration issues is often readily acknowledged, as are related linearity issues (when gage accuracy varies with measurement size); however, measurement error includes many other sources of variation. We can collectively quantify these errors using Repeatability & Reproducibility (R&R) studies.
Repeatability error is sometimes called Equipment Variation, since it can be dominated by a consistent error that seems built-in to the measurement device. Reproducibility error is sometimes referred to as Appraiser Variation, since it is estimated by comparing the difference in measurements from one appraiser to another. An effectively designed R&R study will provide estimates of error within the larger measurement system, which should include measurement method, sample preparation, error due to improper fixturing (or secure holding) of the measurement piece, and variation within the units sampled (for example), in addition to error strictly limited to the earlier definitions of equipment and appraiser variation.
R&R Studies are conducted by obtaining a sample of real parts or units to be inspected, and asking representative appraisers normally tasked with measuring the parts to measure each part multiple times. (Each measurement is called a trial). A typical study involves three appraisers measuring 10 parts three times, for a total of 90 measurements. The number of parts, appraisers, and trials can vary from case to case, but we need multiple trials to estimate Repeatability and multiple appraisers to estimate Reproducibility. Use real production parts, representative of the piece-to-piece variation and within piece variation that can occur in the process. Mask the numbering of the samples, and randomize the order they’re presented to each appraiser for each trial. Insist each measurement trial include all the steps normally taken for measurement of the part, including any sample preparation or adjustments to the measurement system. (It’s not uncommon to find that appraisers regularly recalibrate their measurement equipment, which can increase the measurement error!)
The R&R data can be analyzed several ways. The X-bar/Range chart of Figure 1 provides an initial view of the data analysis. The Range chart shown in the bottom left of Figure 1 plots the Part Range: the range between the three trials for each part by each appraiser. The plotted Part Ranges are within the statistical limits shown on the Range chart, implying that the repeatability (i.e. the ability for an appraiser to obtain consistent measurements for a given part) is relatively consistent for all appraisers’ measurements for all parts.
The X-bar chart shown in the top left of Figure 1 plots the Part Average: the average of the three trials for each part by each appraiser. The variation from point to point across the X-bar chart is an estimate of the process variation. The statistical limits (i.e. red lines) on the X-bar chart are based on the average from the Range chart, providing an estimate of the repeatability error of the measurement system. We’d like the appraisers to detect the real differences between part sizes, despite measurement error, so it is desirable for “most” of the plotted points on the X-bar chart to be outside the statistical limits. In this case, 18 of the 30 part averages are beyond the limits, implying that repeatability error is sufficiently small relative to process variation. The statistics in the right pane of the figure confirms the Repeatability is only 5% of the total process variance. (Note: The statistics provided in the right pane were calculated using the ANOVA method.)
Estimates for reproducibility, the error attributed to differences between appraiser measurements for each part, are also shown in the statistics pane. In this case, reproducibility is a slightly larger issue, representing 7% of total process variance.
Repeatability and Reproducibility are shown separately and combined (labelled Repeatability & Reproducibility) in the statistics pane as a percent of the total process variation (%Variation) and percent tolerance (%Tolerance). Note that the % Variance estimates add to 100%; the % Variation and % Tolerance do not, as standard deviations are not additive. % Process Variation provides insight into how the measurement error affects your control chart and corresponding capability indices. % Tolerance indicates how much of your specifications are consumed by measurement error.
Typical recommendations for combined R&R as % Process Variation and % Tolerance, such as published by AIAG (Automotive Industry Action Group), are 10% or less. Above 30% for either is unacceptable; 10-30% is considered marginal.
In this case, although true part to part variance (Part-% Variance) is 88% of the total, combined R&R measurement error is nearly unacceptable (26%) relative to tolerance and unacceptable (35%) relative to process variation.
Fortunately, further analysis may yield more insight towards an improvement path. Figure 2 shows a Reproducibility chart for the data. The bottom chart shows the Range between the appraisers’ average for each part. If one of the appraiser’s average for a given part was much different from the other appraisers’ averages, we’d expect to see that part beyond the statistical limit on the bottom chart.
The top chart of Figure 2 shows the average of all measurements for each appraiser, the basis of the reproducibility estimate. In this case, the appraiser averages are statistically different, as demonstrated by the points plotted beyond the statistical limits. Melanie’s measurements are slightly higher than expected, while Harry’s are lower.
Figure 3 shows the Repeatability chart, with separate limits calculated for each appraiser. Here, we notice Harry’s repeatability error (bottom chart) is noticeably larger than the other appraisers. Since the other appraisers used the same measurement equipment, this might suggest a general inconsistency in Harry’s measurement technique. The top chart show Harry’s average noticeably lower than the others, evidence of a potential bias in his measurements. Indeed, if we exclude Harry from the analysis, the combined R&R drops from 12% to 5% of variance, from 35% to 22% of process variation and from 26% to 17% of tolerance. These would be reasonable targets if we understood and corrected the increased variation in Harry’s trial to trial (repeatability) error and his measurement bias (reproducibility error). Many times, it’s a matter of technique, so it’s useful for the analyst to conduct the study and observe (without comment) the appraisers’ methods. The results may direct us towards new best practices that recognize requirements for sample preparation or reconcile within piece variation. For example, when measuring a diameter where an out-of-round condition may exist, is the maximum or minimum diameter reported?
The ANOVA analysis indicates the Appraiser*Part interaction is statistically significant, implying that a portion of the Reproducibility error is associated with differences specific to one or more parts. (Typically we consider a p-value of 0.05 or less for significance.) From the statistics pane, we see the Appraiser*Part interaction represents 3.7% of total variance, or about half of the Reproducibility Variance. Returning to Figure 2, we see that the range between appraiser averages for part 6 is larger than the other parts, approaching (yet within) the statistical limit. When the interaction is limited to one or a few identifiable parts, it’s useful to look for measurement challenges on those pieces. For this data, excluding part 6 from the analysis does not remove the significance of the Appraiser*Part interaction, so the interaction is not limited to part 6; however, excluding Harry from the analysis removed the statistical significance of the interaction, again confirming the significance of his measurements to the Reproducibility error. A review of Figure 3 shows a general inconsistency between Harry and the other appraisers on multiple parts. While looking for measurement challenges on part 6 is warranted given its increased Reproducibility error, a comparative review of the appraisers’ techniques, not limited to part 6, would also be appropriate.
Looking for a reprint of this article?
From high-res PDFs to custom plaques, order your copy today!


