Shifting the Paradigm: Enhancing Process Capability Reporting
The following presents an alternative to Cp, Cpk, Pp, Ppk process capability indices.

In my last blog, undesirable traditional “Issues with Cp, Cpk, Pp, Ppk process capability indices reporting”, process capability indices reporting attributes were described. This blog will provide a resolution to those issues by offering an easier to understand alternative, which offers greater insight than traditional Cp, Cpk, Pp, and Ppk process capability indices reporting. The focus in this blog will be on continuous-data process capability indices reporting, while a later blog will address the same question for attribute situations.
For the scenario described previously in “Issues with Cp, Cpk, Pp, Ppk process capability indices reporting”, a parts per million rate or percentage non-conformance reported rate was suggested as a means that is easier to understand than calculated process capability indices. What was suggested is a preference for the report format of 268,525.98 parts per million or 27% nonconformance over traditional process capability indices reporting of Cp=1.82, Cpk=1.44, Pp=0.38, and Ppk=0.30.
In addition, if the data used to determine this reporting non-conformance rate are from a recent region of stability, we can also state that the process is predictable with an estimated failure rate which everyone can relate to; e.g., 27% non-conformance.
A graphic in conjunction with the presentation of a capability statement can provide insight. “Issues with Cp, Cpk, Pp, Ppk process capability indices reporting”, described a commonly used format for this visual presentation. However, I have found that this type of presentation is more meaningful if a probability plot were used in lieu of a probability-density-function graphic to describe process capability with an estimated percentage non-conformance rate, as illustrated in the figure below. This approach is also very effective to address data whenever non-normality occurs; e.g., using a log-normal probability plot to describe process capability with an estimated non-conformance rate.
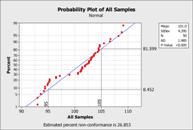 At the bottom of this figure, the reported probability-plot-determined non-conformance rate of 26.853% (i.e., (100-81.599) + 8.452 = 26.853) is displayed. One should note how this calculated value of 26.853 is exactly the same as the reported percentage using the traditional process-capability reporting format shown in “Issues with Cp, Cpk, Pp, Ppk process capability indices reporting”, i.e, 268525.98 /1,000,000 = 26.853.
One might have concern that we are making a process capability statement for this situation since the hypothesis of normality for this data set should be rejected; e.g., the reported p-value in the plot is less than the typical decision point of 0.05. This is a valid point; however, we should note that with the other form of process capability reporting, this non-normality issue was not even been considered. This is one illustration of how more information is gained through a probability-plot format for process capability reporting than the traditional approach.
However, relative to this non-normality statement and its implication, I will make three points. First, in the real world if there are enough data, very few situations are truly normally distributed. Secondly, often there is something we can learn from a non-normally described graphic. In this situation, the data were randomly generated so that there was a difference between and within subgroup variability. Thirdly, is the estimate close enough so that it leads to the most appropriate activity? For this case I think it does. Even if our estimate is off a few percentage points we would probably still take the same action; e.g., consider a process improvement project if this non-conformance rate is considered to be too large.
When this data are from a recent region of stability, this prediction is based on the assumption there will be no overall change in future process response levels. This assumption needs to be continually assessed through a 30,000-foot-level control chart to see if there is evidence that the process has changed or not. More details about the 30,000-foot-level reporting format will be described in future blogs; however, the technique was earlier discussed in the blog “Why Individuals control charts are typically better than x-bar and R charts.”
One can next calculate the cost of poor quality (COPQ) or the cost of doing nothing differently (CODND) for this process. If the COPQ/CODND amounts are unsatisfactory relative from an enterprise’s assessment, this need would pull (used as a lean term) for the creation of a Lean Six Sigma project. With this overall approach, the entire system is assessed when process improvement activities are being identified. This differs from frequently used methods for performance reporting, for example stop-light scorecards, which often can lead unstructured activities that are not productive when one tries to understand the cause of isolated events, which are really common cause.
Metrics drive behavior; however, one needs to be sure that the most appropriate sampling and control charting techniques are used to give this process assessment. The 30,000-foot-level control and corresponding capability and performance metrics approach provides a high-level view of what the customer is experiencing. My intent in looking at the big picture is not to get someone to use these metrics to fix problems, it is to stimulate activities for first the separation of common cause process variability from special cause conditions, where special-cause situations may require immediate attention since something changed, perhaps dramatically.
Reference: The content of this blog was taken from Chapter 12 of IEE Volume III .
In my last blog, undesirable traditional “Issues with Cp, Cpk, Pp, Ppk process capability indices reporting”, process capability indices reporting attributes were described. This blog will provide a resolution to those issues by offering an easier to understand alternative, which offers greater insight than traditional Cp, Cpk, Pp, and Ppk process capability indices reporting. The focus in this blog will be on continuous-data process capability indices reporting, while a later blog will address the same question for attribute situations.
For the scenario described previously in “Issues with Cp, Cpk, Pp, Ppk process capability indices reporting”, a parts per million rate or percentage non-conformance reported rate was suggested as a means that is easier to understand than calculated process capability indices. What was suggested is a preference for the report format of 268,525.98 parts per million or 27% nonconformance over traditional process capability indices reporting of Cp=1.82, Cpk=1.44, Pp=0.38, and Ppk=0.30.
In addition, if the data used to determine this reporting non-conformance rate are from a recent region of stability, we can also state that the process is predictable with an estimated failure rate which everyone can relate to; e.g., 27% non-conformance.
A graphic in conjunction with the presentation of a capability statement can provide insight. “Issues with Cp, Cpk, Pp, Ppk process capability indices reporting”, described a commonly used format for this visual presentation. However, I have found that this type of presentation is more meaningful if a probability plot were used in lieu of a probability-density-function graphic to describe process capability with an estimated percentage non-conformance rate, as illustrated in the figure below. This approach is also very effective to address data whenever non-normality occurs; e.g., using a log-normal probability plot to describe process capability with an estimated non-conformance rate.
One might have concern that we are making a process capability statement for this situation since the hypothesis of normality for this data set should be rejected; e.g., the reported p-value in the plot is less than the typical decision point of 0.05. This is a valid point; however, we should note that with the other form of process capability reporting, this non-normality issue was not even been considered. This is one illustration of how more information is gained through a probability-plot format for process capability reporting than the traditional approach.
However, relative to this non-normality statement and its implication, I will make three points. First, in the real world if there are enough data, very few situations are truly normally distributed. Secondly, often there is something we can learn from a non-normally described graphic. In this situation, the data were randomly generated so that there was a difference between and within subgroup variability. Thirdly, is the estimate close enough so that it leads to the most appropriate activity? For this case I think it does. Even if our estimate is off a few percentage points we would probably still take the same action; e.g., consider a process improvement project if this non-conformance rate is considered to be too large.
When this data are from a recent region of stability, this prediction is based on the assumption there will be no overall change in future process response levels. This assumption needs to be continually assessed through a 30,000-foot-level control chart to see if there is evidence that the process has changed or not. More details about the 30,000-foot-level reporting format will be described in future blogs; however, the technique was earlier discussed in the blog “Why Individuals control charts are typically better than x-bar and R charts.”
One can next calculate the cost of poor quality (COPQ) or the cost of doing nothing differently (CODND) for this process. If the COPQ/CODND amounts are unsatisfactory relative from an enterprise’s assessment, this need would pull (used as a lean term) for the creation of a Lean Six Sigma project. With this overall approach, the entire system is assessed when process improvement activities are being identified. This differs from frequently used methods for performance reporting, for example stop-light scorecards, which often can lead unstructured activities that are not productive when one tries to understand the cause of isolated events, which are really common cause.
Metrics drive behavior; however, one needs to be sure that the most appropriate sampling and control charting techniques are used to give this process assessment. The 30,000-foot-level control and corresponding capability and performance metrics approach provides a high-level view of what the customer is experiencing. My intent in looking at the big picture is not to get someone to use these metrics to fix problems, it is to stimulate activities for first the separation of common cause process variability from special cause conditions, where special-cause situations may require immediate attention since something changed, perhaps dramatically.
Reference: The content of this blog was taken from Chapter 12 of IEE Volume III .