Quality Magazine logo
search
cart
facebook twitter linkedin youtube
  • Sign In
  • Create Account
  • Sign Out
  • My Account
Quality Magazine logo
  • NEWS
  • PRODUCTS
    • FEATURED PRODUCTS
    • SUBMIT YOUR PRODUCT
  • CHANNELS
    • AUTOMATION
    • MANAGEMENT
    • MEASUREMENT
    • NDT
    • QUALITY 101
    • SOFTWARE
    • TEST & INSPECTION
    • VISION & SENSORS
  • MARKETS
    • AEROSPACE
    • AUTOMOTIVE
    • ENERGY
    • GREEN MANUFACTURING
    • MEDICAL
  • MEDIA
    • A WORD ON QUALITY PUZZLE
    • EBOOK
    • PODCASTS
    • VIDEOS
    • WEBINARS
  • EVENTS
    • EVENT CALENDAR
    • IMTS
  • DIRECTORIES
    • BUYERS GUIDE >
      • Supplier Insights
    • NDT SOURCEBOOK
    • VISION & SENSORS
    • TAKE A TOUR
  • INFOCENTERS
    • Digital Quality Management Systems
    • NEXT GENERATION SPC & QUALITY ANALYTICS
  • AWARDS
    • ROOKIE OF THE YEAR
    • PLANT OF THE YEAR
    • PROFESSIONAL OF THE YEAR
  • MORE
    • Expert Columns
    • NEWSLETTERS
    • QUALITY STORE
    • INDUSTRY LINKS
    • SPONSOR INSIGHTS
  • EMAG
    • eMAGAZINE
    • ARCHIVES
    • CONTACT
    • ADVERTISE
  • SIGN UP!

Is "Data Driven" Just Another Buzzword?

By Evan Miller
July 15, 2009

One of the common denominators for most quality improvement methodologies is that we must be "data driven." The term is so commonly used and so poorly defined that sometimes I wonder if "data driven" is just another buzzword like "core values" or "employee empowerment" or "cultivate synergistic paradigms."

"Data driven" seems to mean anything the speaker wants it to mean. There is no standardized definition of "data driven," nor is there a standard measurement for how "data driven" an organization is. That seems rather odd to me. If you're going to strive to become "data driven," shouldn't we know where we're headed? Shouldn't we have a common operational definition of the term? As a starting point I offer the Data Cost / Data Value Matrix.

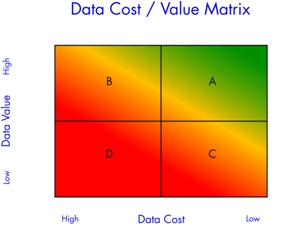
The Data Cost / Data Value Matrix is a simple two-by-two matrix that helps us talk about what it means to be "data driven." On the horizontal axis we have the cost of data, going from high to low. On the vertical axis we have the value of data, going from low to high. The matrix gives us four quadrants. The "data driven" organization lives in Quadrant A, in the upper-right corner. Data are inexpensive and of high value. In my experience very few businesses meet this definition. Some have pockets of excellence, but most fall short of realizing their full potential.

While there may be an infinite number of ways companies fall short of being "data driven," my experience is they fall into three broad categories, and they are represented by the other three quadrants on the matrix. I’ve seen all of these companies, and maybe you have too.

Companies in Quadrant B gain high value from their data, but pay way too much for the knowledge. From what I've seen, many Six Sigma companies fall into this bucket. For the most part these people understand how to maximize the value of the data. They know how to use the full array of statistical tools. They apply proven, disciplined techniques of project management and statistical problem solving to get to the bottom of chronic, entrenched problems. Payback from these programs can be huge.

However, many Six Sigma Belts spend an inordinate amount of time scrubbing and massaging data in order to get something useful. I like to call this effort the Six Sigma Data Shuffle.

Oddly this pattern is seen as normal in the Six Sigma world. If somebody in your organization has to copy files from one folder to another, reorganize the data in some new format (convert from .csv to .xls) and then scrub the data so that all descriptive fields match (make McConnell, F. and Frank McConnell into F. McConnell), all before you copy it into the final software program, where you have to group it into appropriate samples and manually enter specifications before you can begin to analyze the data, then you are paying too high a price for clean data.

Folks in Quadrant C seem to pursue data for data’s sake. They build elaborate data collection systems that effectively protect themselves from their customer. This data provides little or no additional value to the business. An example of this is the quality manager who once told me, "If the customer calls with a complaint, I’ll print out a blast of several thousand data points and email it to him. He gets real quiet when he discovers I have the data." The fact that these data are rarely used to make improvements to the process (and thereby eliminating the customer’s complaint) doesn’t seem to concern this manager. Data are cheap, but the only value comes from being able to "snow" the customer. Often this data is cheap because it is what CAN be collected, not what SHOULD be collected.

The third camp (Quadrant D) has the worst of both worlds: they pay a high price for data, but have almost nothing to show for their efforts. This is typical of mature organizations with a long tradition of inspecting quality into a product. Here it is 2009 and these businesses have enormous file cabinets full of hand written data sheets. Data are written on an inspection sheet and then filed away. Getting to the data is a laborious process requiring the patience of Job and the dogged determination of Wile E. Coyote.

In a future post I’ll share a quick test that I've developed so you can determine just how "data driven" your company is. Or you can download a white paper on the "Eight Aspects of the Data Driven Business - Exploring your Gap to Entitlement" here.

In the meantime, tell me what you think of this definition for "data driven." What's missing? What is on target? And while you're at it, what’s your best guess? Which quadrant does your business live in?

Copyright Hertzler Systems Inc., 2009. Used by permission.

Share This Story

Evan Miller joined Hertzler Systems Inc. (Goshen, IN) in 1984. For the next seven years he held positions within the company in sales, marketing, technical support and training. In 1991 when founder Paul Hertzler retired from the firm, Miller became president and is now co-owner of the company.

Blog Topics

Shifting the Paradigm

Jim's Gems

Steve Adams: Operational Strategies

Recent Comments

Therefore great deal to take place over kinds...

Gee… I translate writes on a similar to...

As it turned out, it is quite possible...

For some it is significant, and so research...

nike tiffany and co jacket

Manage My Account
  • eMagazine Subscriptions
  • Newsletters
  • Online Registration
  • Subscription Customer Service
  • Manage My Preferences

More Videos

Sponsored Content

Sponsored Content is a special paid section where industry companies provide high quality, objective, non-commercial content around topics of interest to the Quality audience. All Sponsored Content is supplied by the advertising company and any opinions expressed in this article are those of the author and not necessarily reflect the views of Quality or its parent company, BNP Media. Interested in participating in our Sponsored Content section? Contact your local rep!

close
  • Key Takeaways for Quality Leaders
    Sponsored byComplianceQuest

    Key Takeaways for Quality Leaders from the 2026 Gartner Magic Quadrant™ for QMS

  • This image shows a person seated next to a Bobcat T66 compact track loader.
    Sponsored byPolyWorks by InnovMetric

    Supercharging Digital Gauging at Bobcat North America

  • Dorsey Calibration Lab photo by Tom LaBarbera Picture this Studios
    Sponsored byDorsey Metrology International

    Ensuring Product Quality in a Competitive Manufacturing Landscape

Popular Stories

a titanium diaphragm speaker driver

The One Thing Elon Gets Right Is Designed to Scare You

This image shows a person seated next to a Bobcat T66 compact track loader.

Supercharging Digital Gauging at Bobcat North America

Dorsey Calibration Lab photo by Tom LaBarbera Picture this Studios

Ensuring Product Quality in a Competitive Manufacturing Landscape

2026 Quality Professional of the Year!

Events

June 9, 2026

Future-Proof your Quality Processes with Advanced 3D Optical CMM Technology

Discover how to effortlessly capture complex data, leverage true multi-sensor automation, and ensure continuous operation without creating inspection delays.

June 22, 2026

Automate 2026

Automate is North America's largest robotics and automation event — and the best place to take your ideas from insight to impact.
 
Our show floor features the world’s leading automation solutions, from AI and robotics to motion control, vision systems, and more. Plus, our educational conference is second to none, led by the brightest minds in automation today.
 
Ready to transform the way you work? Take the next step at Automate.
View All Submit An Event

Products

Lean Manufacturing and Service Fundamentals, Applications, and Case Studies

Lean Manufacturing and Service Fundamentals, Applications, and Case Studies

See More Products
Quality Podcast Channel Custom Content
×

Stay in the know with Quality’s comprehensive coverage of
the manufacturing and metrology industries.

Newsletters | Website | eMagazine

JOIN TODAY!
  • RESOURCES
    • Advertise
    • Contact Us
    • Directories
    • Manufacturing Division
    • Store
    • Want More
  • SIGN UP TODAY
    • Create Account
    • eMagazine
    • Newsletters
    • Customer Service
    • Manage Preferences
  • SERVICES
    • Marketing Services
    • Market Research
    • Reprints
    • List Rental
    • Survey/Respondent Access
  • STAY CONNECTED
    • LinkedIn
    • Facebook
    • YouTube
    • X (Twitter)
  • PRIVACY
    • PRIVACY POLICY
    • TERMS & CONDITIONS
    • DO NOT SELL MY PERSONAL INFORMATION
    • PRIVACY REQUEST
    • ACCESSIBILITY

Copyright ©2026. All Rights Reserved BNP Media, Inc. and BNP Media II, LLC.

Design, CMS, Hosting & Web Development :: ePublishing