Back to Basics: Industrial Computed Tomography

Industrial computed tomography (CT) is a unique nondestructive evaluation technique for inspecting interior structures of test objects. While computed tomography has long been used by radiologists for medical diagnostics applications, industrial CT brings the same technique to inspection applications. By utilizing the penetrating capabilities of X-rays, the technology generates cross-sectional images of an object for detailed analysis. The cross sectional images and the 3-D views (volume rendered by processing of cross-sectional images) provide the inspection specialist with a wide range of options for detecting cracks and air voids; measuring distances, areas and volumes; and locating the problem areas in hard-to-access components. All analysis is done using a workstation computer integrated within the CT imaging system that runs viewer software to visualize the tomography data.

2-D Comparison
Traditional X-ray imaging produces 2-D images in which all internal structures are overlapped. In comparison, computed tomography provides clearer digital images that show the internal structures without any overlap. It also allows full manipulation of 3-D images for visual inspection from any preferred angle, removal of any part to expose the region of interest, and many other advanced imaging tools. A CT imaging system allows the operator to perform inspection at the end of the imaging process (visualization stage), whereas with 2-D traditional X-ray imaging the inspection usually takes place during the imaging session. In CT imaging systems, the analysis tools of accompanying visualization software define inspection capabilities.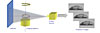
Cone Beam CT
Differing from conventional tomography with its cone-shaped X-ray beam, cone beam computed tomography is a popular imaging technique. It allows high-resolution imaging and fast scanning time. Unlike the linear array detectors used in conventional tomography systems, cone beam CT systems use 2-D area detectors and a cross-sectional image reconstruction algorithm for cone beam geometry. Similar to most X-ray inspection systems, a typical cone beam CT imaging system consists of the following components:- X-ray tube
- Imaging detector
- Manipulators
- Radiation shielded cabinet enclosure or shielded room
- Acquisition and image processing computer unit

Cone Beam CT Imaging Workflow
CT imaging workflow begins with the acquisition of X-ray images, which are usually referred to as projections. Projections are the images captured with the imaging detector during X-ray generation. They are gray scale images with bit depth of 8 to 16 bits depending on the type of detector. In cone beam CT, the acquisition of projection images is usually done by rotating the scanning object a full 360 degrees with a high-precision motion controlled rotational stage during X-ray generation. Some systems use a different geometry where the object is stationary and the imaging system is rotating around the object. The imaging detectors can be configured to capture images at various frames per second and synchronized with the rotational stage motion control unit. This enables various configurations for acquiring projections in 360-degree full rotation (for example, 360 projections or 720 projections). In most cases, a faster acquisition frame rate results in reduced image quality.Reconstruction Power
Acquired projections are processed with a special software algorithm in order to reconstruct the cross-sectional images of the scanned object. This process is known as image reconstruction, and is one of the most import factors in determining the image quality and the CT system’s throughput. It also is easily the most compute-intensive part of a CT system. A typical configuration acquires 720 projections to produce 512 cross-sectional images, each 512 by 512 pixels. This results in almost 100 billion calculations, each requiring several basic additions and multiplications. Another often-used scenario with 1,440 projections and 1,024 cross-sectional images, each with 1,024 by 1,024 pixels, requires 1.5 trillion calculations. To accelerate this compute-intensive task, some solution providers offer hardware-based cone beam reconstruction solutions, but it is possible to find software solutions as well.After the reconstruction process the reconstructed data can be stored on a hard disk drive (HDD) or can be transferred to a database of a visualization workstation for 2-D and 3-D advanced analysis. The stored data is typically written in DICOM (standard medical format) or DICONDE formats.

Visualization
Visualization is the final stage of CT imaging workflow; the operator manipulates the scanned object’s reconstructed digital image on a computer interface in 2-D or 3-D views. Advanced visualization workstations offer great-value image analysis tools for detailed inspection. Using density threshold settings, cutting and cropping tools, and cut-plane features, it is possible to see the interior of an object very clearly without destroying it. Zoom capability and easy navigation around the region of interest allow the operator to identify defected regions or locate a component conveniently.
The visualization process is the rendering of reconstructed cross-sectional images into a 3-D, full-body volume image. After the digital 3-D image of the scanned object is uploaded to the imaging workstation, the operator selects from a wide range of options to utilize the benefits of the CT technology using the imaging tools on the imaging workstation software.
Visualization workstations require intense computation to volume render datasets of cross-sectional images, which typically can size up between 500 megabytes to 1 gigabyte. Therefore, hardware quality and HDD speed is of great importance for efficient performance. Dedicated volume rendering hardware is an accepted solution for enhanced performance speed for the advanced visualization workstations.
Looking for a reprint of this article?
From high-res PDFs to custom plaques, order your copy today!


 and Digital X-ray Inspection Services")
