Computed Tomography Scans: The Latest Tool for Industrial Quality Evaluation
There is virtually no limit to the quality evaluation applications of CT scanning.
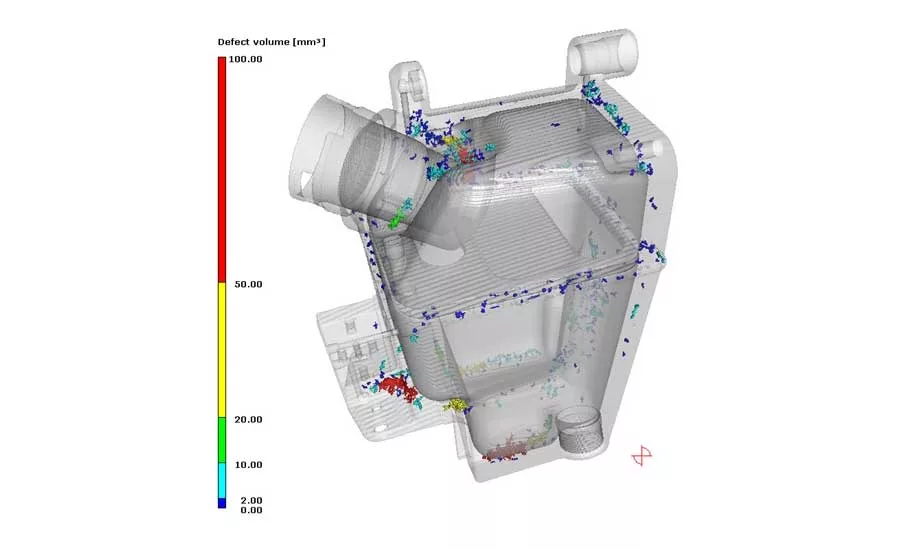
Fig. 1. Lung ventilator component.
Computed tomography (CT) uses irradiation to produce 3D internal and external representations of scanned objects. The beginnings of CT scanning technology date back to the early 1970s. Although it was originally developed for medical imaging, CT is now used in a wide array of industrial applications including flaw detection, failure analysis, metrology, assembly analysis and reverse engineering.
The word tomography comes from the Greek words tomos (meaning slice) and graphein (meaning to write), and the word literally means “imaging by sections.” A CT scan generates a series of 2D projection images at different rotational angles. These images are reconstructed with computer software to produce a 3D representation of the object that can be manipulated and studied.
Let’s take a quick look at the main components of CT systems and how they work together to create a 3D image.
CT System Components:
Manipulator
As the name suggests, this component manipulates and rotates the object being inspected to allow the X-ray source and detector to take multiple images at many different viewing angles.
X-ray Source
Two basic types of X-ray sources are most commonly used in industrial CT systems today. Mini-focus tubes have higher power than micro-focus tubes, with potential energies from ~20 keV (kiloelectron-volts) to ~700 keV and can offer maximum power outputs ranging from 100 W to ~4.5 kW. Mini-focus focal spot sizes range from ~0.25 mm up to ~6 mm, which is suitable for many types of inspection for structural, automotive, and aerospace applications.
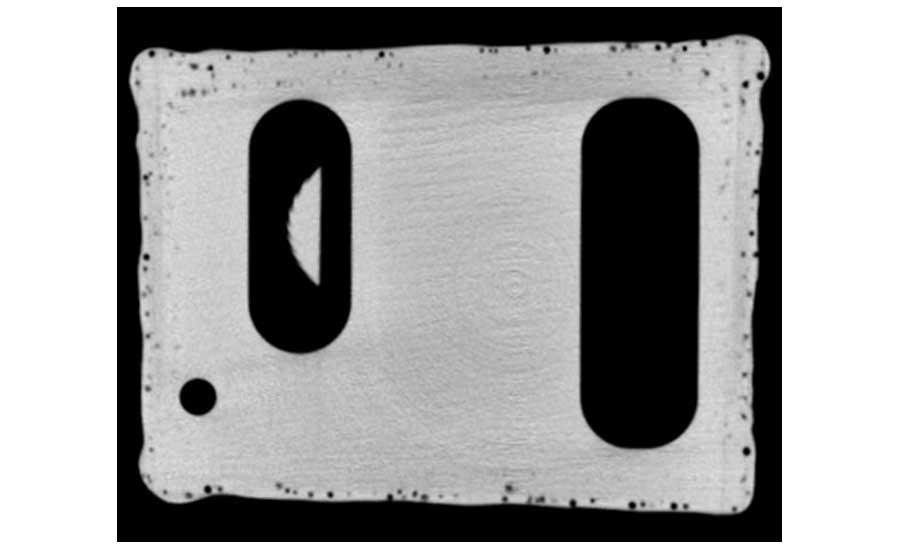
Fig. 2. Porosity from the welding process.
Micro-focus tubes are available with potential energies from ~20 keV up to ~750 keV and can offer power outputs ranging from <1 W up to ~0.5 kW. Micro-focus focal spot sizes range from ~1 µm to ~300 µm.
Four basic CT scanning techniques are in use today:
- Traditional fan beam CT uses a fan-shaped X-ray beam that is detected by a linear detector array (LDA). Fan beam CT systems involve rotation of the scanned object to produce a single cross-sectional plane. Vertical movement to adjacent cross-sectional heights can produce a volume. This sequence is repeated until the desired area is scanned.
- With the cone beam CT technique, the emitted cone-shaped X-ray beam is detected by a flat panel sensor. These systems are well-suited for small castings, electronic components and other low density or mid-sized parts.
- Helical CT is a type of 3D CT in which the sample describes a helical trajectory relative to the source, while a flat panel detector measures the transmitted radiation on part of the cone beam from the source.
- The laminography technique eliminates the need to rotate the object; instead, the cone beam penetrates it from different angles and the image is processed into single or multiple CT slices. Laminography is well-suited for samples with large aspect ratios, or where there is a specific plane of interest.
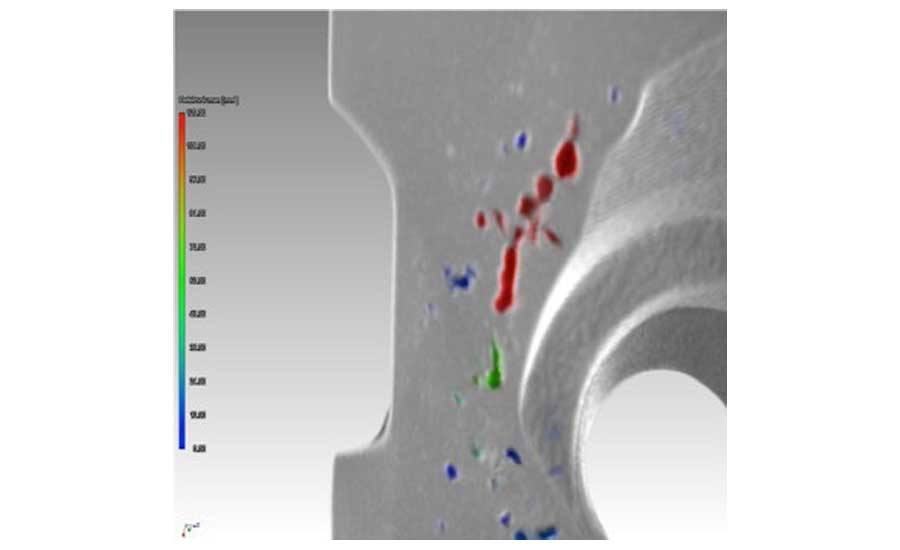
Fig. 3. Defects classified by size.
X-ray Detector
Modern CT systems are typically equipped with either a flat-panel Digital Detector Array (DDA) or a Line Detector Array (LDA).
- Flat-panel DDAs offer very high sensitivity, resolution and bit depth. They produce very clear images with excellent contrast. Their flat surface area and square pixels help prevent distortions.
- LDAs are particularly suitable for high-energy fan beam CT scans of thick-walled components. They can be temperature controlled for more stable performance and many offer individually replaceable detector modules. LDAs are used to minimize scattered radiation, which decreases the image quality at high energies above about 250 kV.
Acquisition and Reconstruction
To generate a CT data set, a series of 2D X-ray images are taken at specific rotational steps, usually through 360 degrees of rotation. As the 2D images are captured, the reconstruction can begin, and “tomograms” are created for each row of pixels.
Tomograms are virtual slices through a three-dimensional object, in which each gray value represents a different density: the brighter the gray value, the denser the material within the object. Black equals empty space or air (in a negative image). The 2D data set is, essentially, a stack of hundreds or thousands of tomograms. Converting this data to create a realistic 3D model is called volume rendering. Volume rendering of the external and internal geometries of the object makes sophisticated, photorealistic visualization possible—with adjustable shadows, opacity, camera angles, video creation, etc.
Typical Industrial CT Quality Evaluation Applications
Although there is virtually no limit to the quality evaluation applications of CT scanning, here are some examples of common ones:
Identifying Porosity and Inclusions
This application involves a critical component of a medical ventilator constructed of two castings welded to two sides of a machined plate. CT was used to identify typical casting defects, welding defects, and porosity in both castings. The manufacturer used this information to improve the process, controlling and minimizing the porosity.
This 3D representation of the dataset of the welded plate (Fig. 1) has a transparent surface to allow perspective for identifying locations within the part. Different colors were used to represent defects of various sizes.
A cross-sectional view through the welded area shows the porosity caused by the welding process. In the cross-sectional image through the cast area (Fig. 2), flaws are color-coded to highlight their size at a glance. Defects can also be displayed to highlight their position and shape (Fig. 3). Pores smaller than a certain size are often non-critical to the function of the part. Location is also important for this application because near-surface flaws are more problematic than those surrounded by a lot of material.
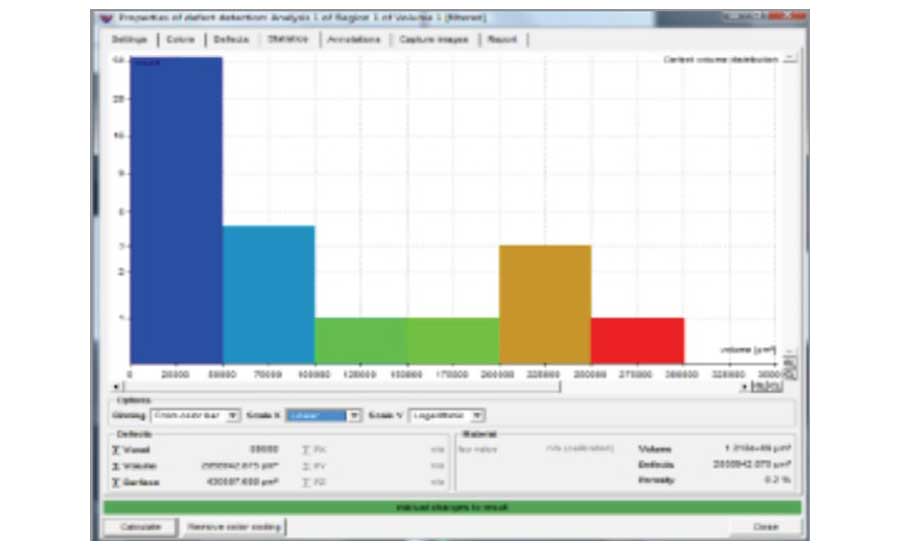
Fig. 4. Defect histogram.
This list of automatically detected defects (porosity) includes characteristics like “size” and “location.” The histogram (Fig. 4) shows the number of defects of different sizes; here, the majority are < 0. 08mm diameter (shown in blue).
Metrology (Nominal/Actual Comparison)
Scanning in 3D is widely used for making external surface comparisons. CT can deliver clean, accurate surface models that don’t require repair or merging before working with them. CT also allows for scanning internal surfaces for nondestructive analysis of internal features.
A CT scan can be compared to a CAD model or two CT scans can be compared to each other. After the two data sets are aligned, the differences can be displayed in color in a 3D model (Fig. 5, bottom right) or with colored needles in cross-sections (Fig. 5, top left, top right, bottom left).
This function is used for:
- Comparing surface distances from a cast part to the CAD model to detect mold deviations or core shifts in aluminum castings.
- Comparing two parts produced at different times over the lifetime of a mold to assess mold wear.
- Comparing a cast part to a machined CAD file to identify open pores where leaks could form after machining.
Metrology (Dimensional Measurement including Internal Structures)
CT is widely used to gather data for creating compliance reports on each cavity of multi-cavity dies for injection-molded plastic parts. It is also invaluable for measuring the properties and geometry of an initial sample item against its specifications for producing a First Article Inspection Report (FAIR) for a specific manufacturing process. CT can also be used to identify tool wear by scanning the parts produced at specified intervals so dimensional changes can be identified and visualized.
With good CT data sets, it is possible to verify many features quickly and with high accuracy with reports created by one of the growing number of software packages available that are capable of handling large STL (standard tessellation language) files or point cloud datasets.
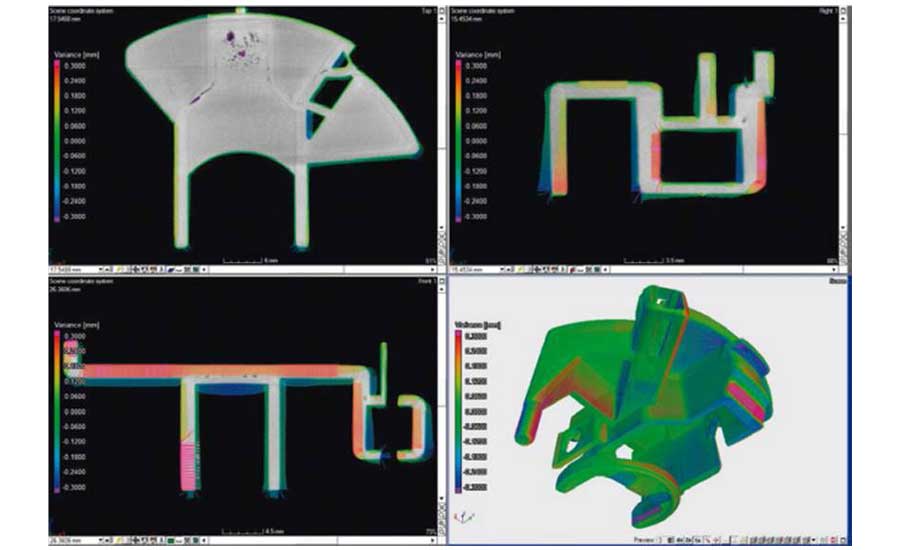
Fig. 5. Comparison of data sets.
Metrology CT offers several advantages:
- Ease of repeatability: Create scans of multiple parts from different cavities and run the same report on every part shortly after scanning.
- Clean data sets: CT requires no data merging or smoothing, making typical surface STL data sets “watertight.”
- Nondestructive testing allows for noncontact measurement: Once the volume data is captured, any dimensional feature can be added after the scan.
- Soft materials (e.g., rubber) can be scanned without the need to contact them.
Structure Analysis
CT offers nondestructive access to view the interior of a variety of man-made materials. This technology is used in a wide range of applications. For example:
- Flow characteristics of a fluid passing through porous media can be measured and visualized using CT.
- CT supports studying the properties of construction materials used in roads and bridges. Concrete samples can be quantified and analyzed before and after fatigue or stress to evaluate changes in the morphology.
- Materials researchers use CT to study the integrity and dimensions of lightweight materials used to reduce the weight of automobiles, aircraft, and spacecraft.
Looking for a reprint of this article?
From high-res PDFs to custom plaques, order your copy today!


