Understanding the Metrology Language for X-ray Computed Tomography
When compared to CMMs, CT as a technique applied for industrial dimensional metrology is relatively new.
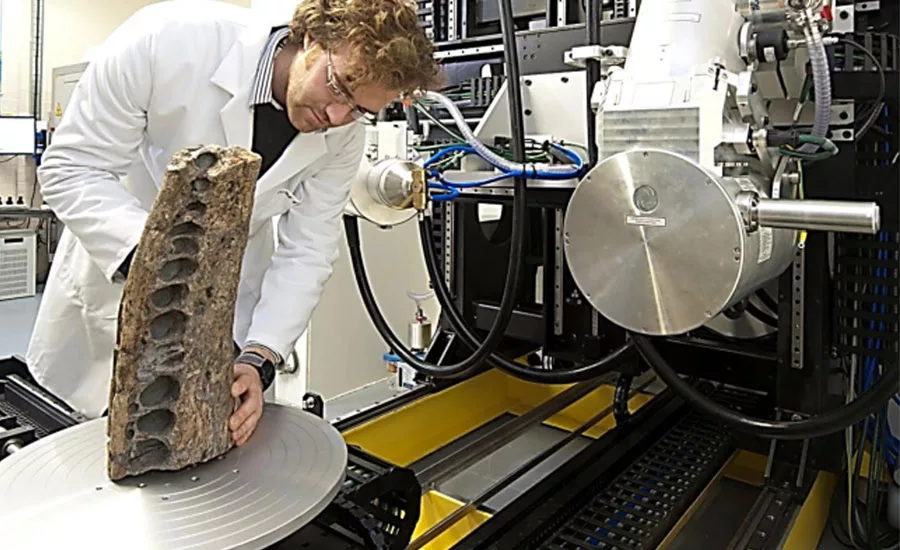
X-ray CT setup for examining a fossil sample.
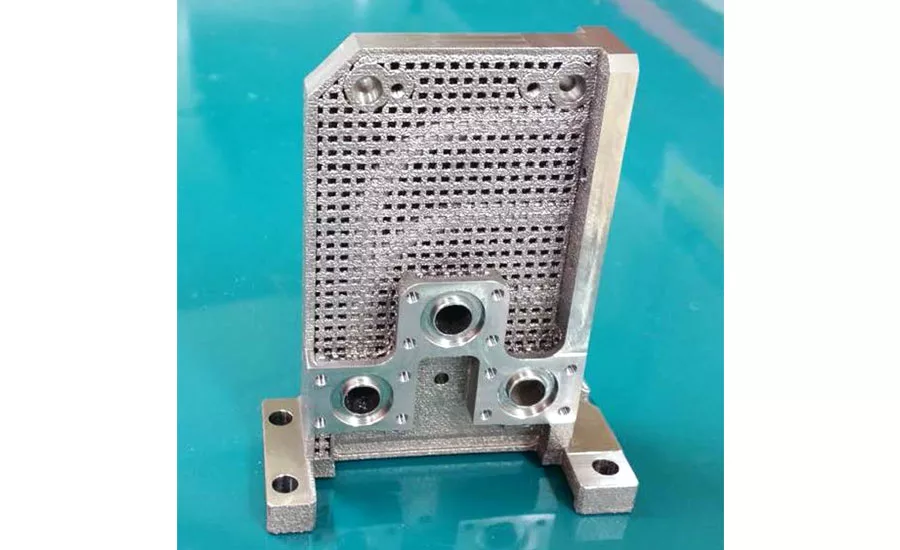
This is a 3D printed cooling manifold exterior.
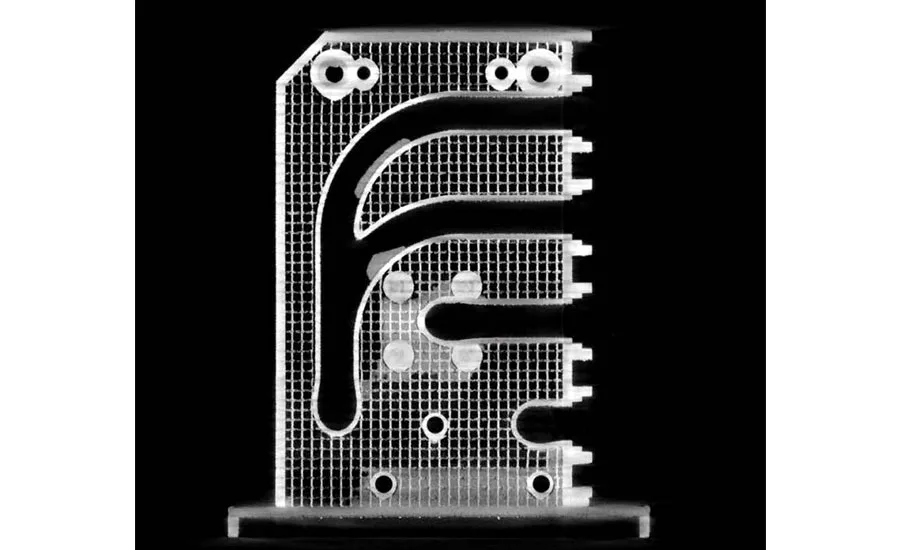
CT scans can reveal cracks and occlusions without destroying the part.
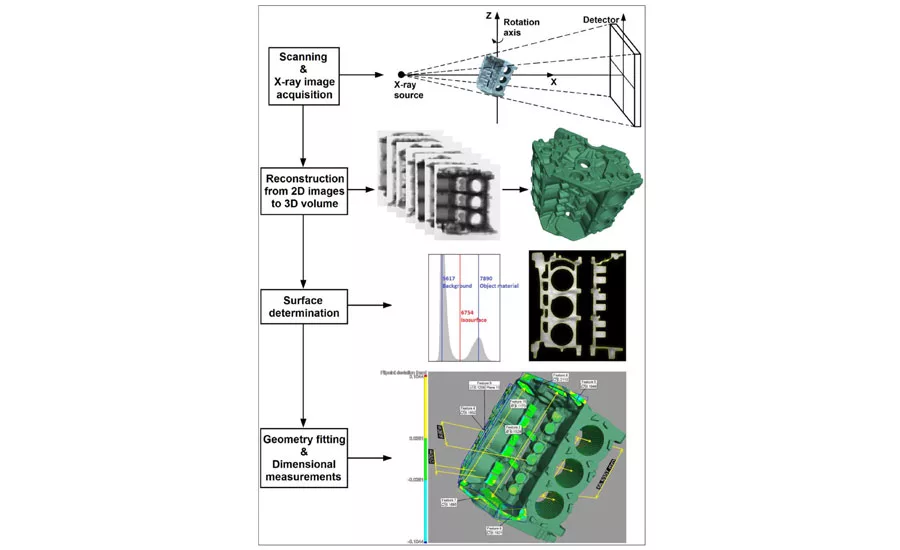
CT workflow chart showing image acquisition, reconstruction, surface determination, and dimensional measurements.
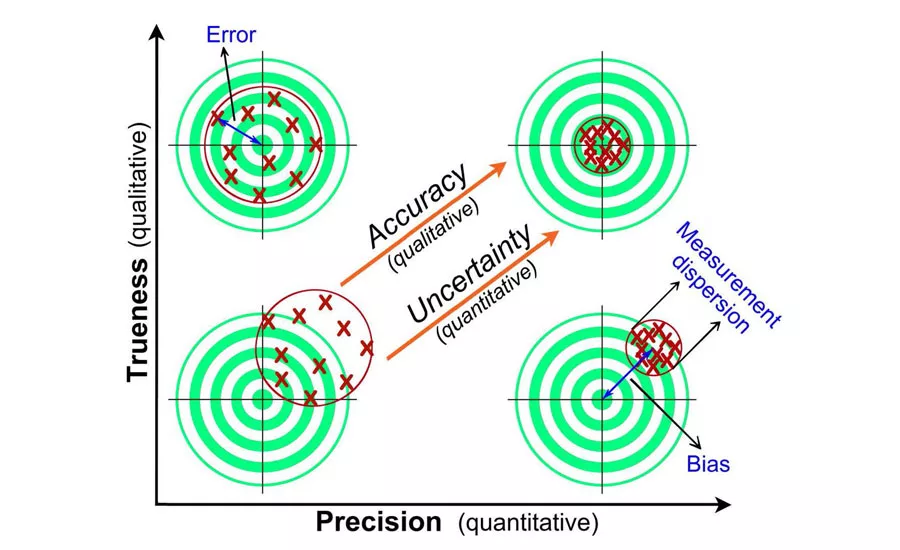
Figure 1 – Target comparison to illustrate trueness, precision, accuracy, and uncertainty. Arrows indicate improving direction. Trueness (qualitative) vs. precision (quantitative).
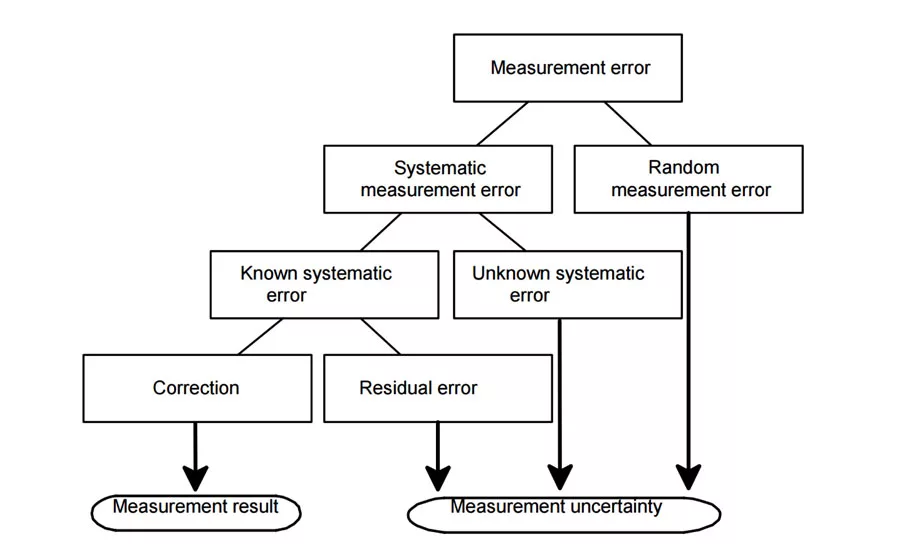
Figure 2: In the field of metrology, a measurement result is incomplete until coupled with an associated uncertainty.
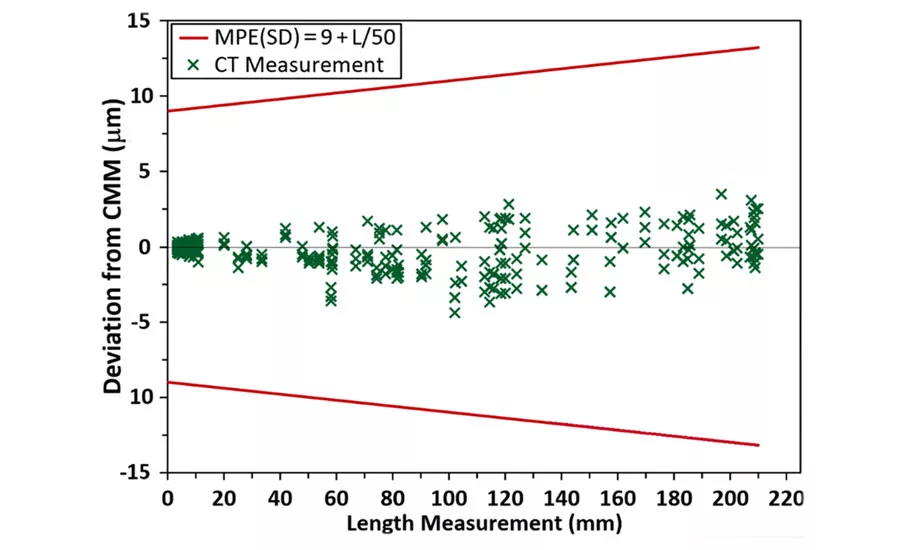
Figure 3: CT measurements obtained with a Nikon’s “MCT 225” system at twelve dif-ferent values of magnifications (27x, 24x, 21x, 18x, 14.5x, 9x, 3x, 2.6x, 2.2x, 1.8x, 1.7x, and 1.6x). The results show deviations ranging from -4.4 µm to 3.5 µm respect to CMM calibrated values provided by NIST, which is a range compliant with the MPE limits.
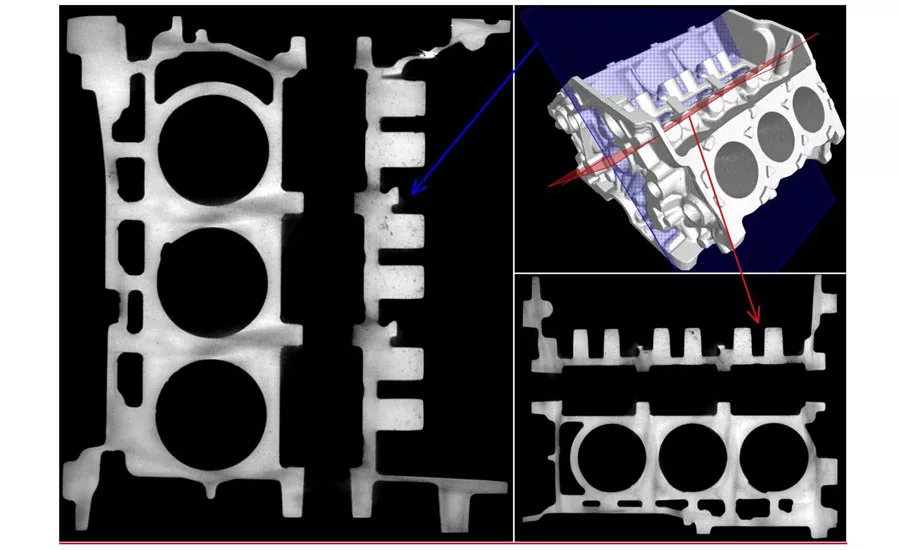
CT images from V6 mini-engine block that was scanned by Nikon’s MCT225 system.
Interest is growing across many industries in the use of X-ray computed tomography (CT) for dimensional metrology in the pursuit of improved quality control. Currently, however, there exists a lack of agreement among governing bodies in metrology, research institutions, technology providers, and other organizations over standards dealing with verifying CT systems’ dimensional metrology performance and developing task-specific measurement uncertainty budgets.
To improve things, first we must define and better understand our terms and work toward creating useful and needed standards. For example, how would you define accuracy? How does it differ from precision? In an interesting TEDEd talk (http://ed.ted.com/lessons/what-s-the-difference-between-accuracy-and-precision-matt-anticole), educator Matt Anicole says the distinction between these two terms is critical for many scientific endeavors, which certainly includes metrology and improved quality control.
Using the legendary story of William Tell being challenged to shoot an apple off his son’s head, Anicole defines accuracy as how close you can come to the correct result. Accuracy improves with the use of well-calibrated tools you are well-trained to operate.
Precision, on the other hand, is how consistently you can obtain that result using the same method. Precision improves with more finely incremented tools that require less estimation. Better equipment together with more detailed procedures equate to an acceptable level of uncertainty for any given project.
Determining that acceptable level of uncertainty involves defining other terms such as random error and systematic error. Here we can introduce another qualitative term: trueness. According to definition 2.14 from the International Vocabulary of Metrology (VIM 3rd edition) trueness of a measurement is the “closeness of agreement between the average of an infinite number of replicate measured quantity values and a reference quantity value.” Trueness is essentially “absence of bias.”
Examining Figure 1, trueness improves with the positive upward direction of the y-axis, moving average results toward the center of the target. When results are offset from the center in the same target area, shown in the lower quadrants, this is significant systematic error, also known as bias, shown in the lower-right quadrant as the difference between average results and the center of the target.
The upper-left quadrant demonstrates a number of results exhibiting no significant bias for their average result, but large random error for individual trials. Here the error is the difference between a single result and the center of the target. The lower-left quadrant shows a set of results having both large systematic and random error. In contrast, the upper right quadrant demonstrates results having small random error and no significant bias.
Precision improves (i.e., decreases in quantity) with the positive direction of the x-axis as it moves to the right, by tightly grouping the results. If many shots are taken, precision can be quantified from the dispersion or size of the results cluster. Precision is poorer as results are more widely scattered. When all results are grouped tightly together, the cluster is considered very precise, but not necessarily accurate. The closer results are to the center of the target, the more accurate they are, so it is not possible to reliably achieve accuracy without precision. Ultimately, with increasing trueness and increasing precision, there is an increasing accuracy and a decreasing uncertainty. The arrows show improving directions.
Uncertainty, or How Long is a Pencil?
One term used to determine the actual value of a characteristic is usually called the measurand: “quantity intended to be measured” (VIM definition 2.3). For example the length of a material object can be quantified in terms of the “meter” unit. As a relatively straightforward exercise: How long is the first pencil you can find on your desk? Naturally it depends on the ruler, measuring tape, or scale you use. Say it’s relatively easy to determine the pencil is between 9 and 9.5 cm, and squinting (zooming in a bit) helps you estimate it is around 9.25 cm. The best answer you might be able give with the measuring instrument you are using (the ruler or measuring tape) is something like: L = (9.25 ± 0.25) cm, or Measurement = Result ± Uncertainty.
In practice, since a “true” or “correct” value of a measurement cannot be absolutely determined, there is always measurement uncertainty associated with a measured value, even for the most careful (calibrated) measurements. So for a measurement result to be completely specified, it should be expressed as a single measured value with an associated measurement uncertainty. Examining the block diagram in Figure 2, uncertainty is the doubt about the true value of the measurement that remains after making a measurement, even if systematic errors are corrected. The measurement uncertainty provides an interval within which the true value of the measurand lies with some level of confidence, and when the measurement result is reported the uncertainty should be included (e.g., expressed as X=x±U, where x is the measured quantity value and U the measurement uncertainty).
Error is represented by the difference between the measurement result and the “true value” of the measurand. The component of the total error of measurement, which varies in an unpredictable way, is called random error. The component that tends to shift all measurements in a systematic, predictable way are known as systematic error.
Uncertainty, then, is a quantitative measure of the likely range of values within which the true value is asserted to lie with some level of confidence. At a minimum, uncertainty could be described approximately by a quantitative indication of the dispersion of quantity values being attributed to the measurand.
What We Have Now
Currently, there is no internationally accepted standard available for metrological performance verification of CT systems. There are some suggested guidelines like the VDI/VDE 2630 Part 1.3, which is not a standard but is the only guideline published so far, in this case by the German body of metrology. For example, one system that is typically used for metrology applications follows the guidelines from the VDI/VDE 2630 part 1.3, providing an MPE (maximum permissible error) statement of the form MPE = 9+L/50 µm (L in mm) for center-to-center measurements (see Figure 3). This general statement is valid within the entire measuring volume, but it can be enhanced by approximately 1/3 factor for a fixed-magnification position.
MPE represents the extreme value of measurement error, with respect to a known reference quantity value, permitted by specifications or regulations for a given measurement, measuring instrument, or measuring system according to the definition 4.26 from the VIM. It represents the limits that should not be overpassed in a measurement test (after calibration of the measuring instrument) in a dispersion chart, when plotting the results of measurement deviations from references or operative “true values.” The mentioned chart is generally provided by the manufacturer, and with the measurements performed on a reference standard (or calibrating artifact). After finishing the calibration of a measuring instrument, the MPE statement given by the manufacturer usually indicates the maximum deviations to be expected in a measurement respect to what could be considered the “true” value of the measurand quantity itself.
As MPE gives an idea of the maximum deviations expected, it is generally quoted as the worst-case scenario, but measurement deviations from CMM as lower as 2 µm or less can be measured as have been reported in university investigations. I particularly suggest reading the following publication from the IOP (Institute of Physics) published in the Measurement Science and Technology journal by The University of Manchester and the UK National Physical Laboratory: http://iopscience.iop.org/article/10.1088/0957-0233/25/6/065401/meta.
When compared to CMMs, which have been on the market more than 50 years, CT as a technique applied for industrial dimensional metrology is relative new (over one decade or two at most). Procedures and/or standards for developing task-specific measurement uncertainty complying to the GUM (the Guide to the expression of uncertainty in measurement shared jointly by the Joint Committee for Guides in Metrology, JCGM) do not currently exist. There is a working document being discussed at the international standardization level by the CT task force of ISO technical committee (TC) 213 working group (WG) 10, which is responsible for creating international standards (series ISO 10360) for the acceptance testing of coordinate measuring systems. At the domestic level, in the United States, there is also an ongoing discussion about the creation of standards for dimensional measurements performed with CT technologies. The initiative is led by the ASME B89.4.23 CT Scanning Committee, and it has some similarities to the ongoing debate from the international standardization group from the ISO committee. The ISO TC 213 WG 10 and the ASME B89.4.23 Committee are both currently concerned with bi-directional (point-to-point) length measurements that are single “points” based on surface data generated from CT scan. This represents a major challenge in CT because of the uncertainties associated with surface determination so guidelines are still needed.
The importance of creating standards or verification procedures for CT metrology is not only to reach homogeneity in the commercial market, but also to avoid confusing interpretations of instrument specification sheets. In general, users still need caution about the instrument specifications, not only because the language of precision metrology can prove complex and sometimes ambiguous, but also because misleading specifications might exist unintentionally. Better defining and understanding terms is only the beginning of a never-ending journey.
References:
[1] BIPM/JCGM, "Guide to the expression of uncertainty in measurement," 2012. [Online]. Available: http://www.bipm.org/en/publications/guides/
[2] BIPM/JCGM, "International Vocabulary of Metrology – Basic and general concepts and associated terms," 2012. [Online]. Available: http://www.bipm.org/en/publications/guides/
[3] Proc. Digital Imaging 2016, An ASNT Topical conference at Mashantucket, CT (USA), pp 44-57, Published by The American Society for Nondestructive Testing, Inc. ISBN: 978-1-57117-384-3
Looking for a reprint of this article?
From high-res PDFs to custom plaques, order your copy today!


