Counting objects in an image seems like an easy task, which can be automated through machine vision and image analysis, but it becomes difficult when objects touch, move randomly, or are hard to distinguish from their background. Image analysis algorithms extract quantitative information from an image. These algorithms run on a machine vision system (MVS) consisting of lighting, cameras, computers and software. In this article we’ll look at using machine vision to solve counting tasks of increasing difficulty.
Humans can rapidly count about four or less objects, a process called subitizing1. With more than four objects counting slows from 50 to 100 milliseconds per additional object to about 250 to 350 milliseconds per additional object and counting accuracy decreases. When you add reaction time2, our counting rate is probably less than five objects a second. Our accuracy is limited and gets worse as counting speed increases and as we get tired and bored.
Image analysis running on a MVS can count objects much faster and more accurately than a human. Objects that are moving, touching, or similar to their background require careful task set up and selection of image analysis algorithms to be accurately counted. Human vision easily and subconsciously does these tasks, although much slower.
Counting Objects Arranged in Single File
A photoelectric sensor can count objects that are arrange in single file and are separate from each other. A bottling line is a good example. Bottles on a conveyer pass in single file and are counted when the neck of a bottle interrupts a photoelectric sensor’s light beam. If the bottle moves backward, it could be counted twice. Backward motion can occur during production line starts and stops or if the bottle rocks while it moves. Two or more side-by-side sensors and timing logic can be used to decrement the count on backward motion, but setting the sensor spacing and timing can be difficult.
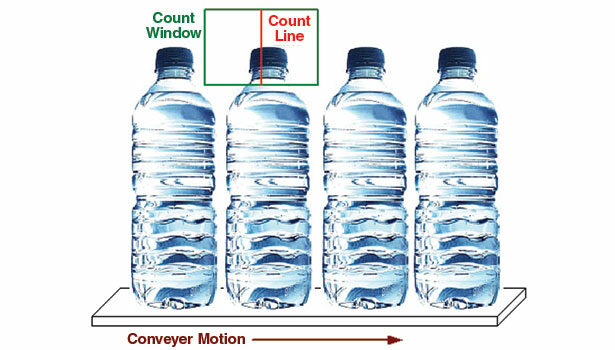
A MVS using image analysis is a simpler solution to set up and to understand. A rectangular Count Window is placed around the bottle neck and some of the space on either side. A Count Line is set in the center of the window. As the bottle enters the Count Window, say from left to right, image analysis detects an identifying feature on the bottle cap, say the center of the black cap, and increments a counter when that feature crosses the Count Line. Backward motion, from right to left, across the count line decrements the counter. The key operations are the identification and tracking of an identifying object feature. This allows the counting algorithm to know the object’s position and direction. The additional cost of a MVS might be justified by also using the system to inspect the seal, fill level, label application, etc. of the bottle3.
Tasks that count multiple objects in ordered or in random positions and moving or not, require a MVS. One of these tasks is counting bottles in crates. Consider counting bottles in shrink-wrapped cartons of 12 with the task of totaling the number of bottles made on a line. A side view with a photoelectric sensor won’t work, as cartons can touch and the first row of bottles may obscures the bottles behind it.
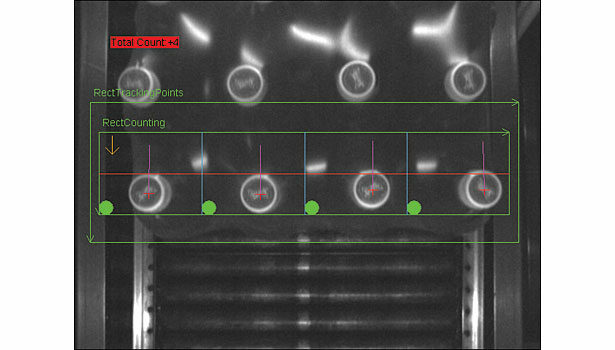
We must view the bottles from above, using some aspect of the bottle caps as an identifying feature. The identifying feature might be color, reflectivity, height, etc. We use pattern matching algorithms, also called search, to find the bottle caps. The MVS learns the pattern of the bottle caps, and then searches for similar patterns in subsequent input images. There are multiple caps in the camera’s view but the MVS can still identify and track the bottle caps because they move in vertical columns. So instead of one Count Window, we have four.
Counting Objects with Random Placement, Size or Spacing
If objects have random placement, size, and spacing or close spacing, the Count Line methods might not work. This method assumes only one identifying feature appears in each Count Window at a time, thus making tracking simply a matter of checking if the identifying feature is on one side or the other of the Count Line.
To deal with some randomness in object size, placement and spacing, image analysis algorithms find an identifying feature on each object; say its center of gravity. An object is counted when it is fully in the Count Window, and then it is tracked out of the Count Window so it is not counted again. The Count Window has to be larger than the largest object and large enough that the entire object appears for at least one image frame.
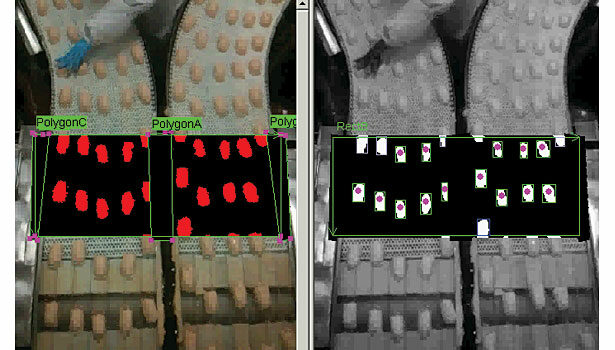
We use counting breaded chicken patties as an example. The patties are differentiated from the background conveyer belt based on color – so red-brown against a white belt. The image values are converted to black (background) and white (patty) and connectivity analysis, sometimes known as blob analysis, is used to group touching (connected) white pixels into “blobs” representing the different patties. The centroid (center of gravity) of each blob is used as its identifying feature and is tracked through the Count Window. Blobs touching the edges of the Count Window are discarded.
Dealing with Touching Objects
When objects touch they must be visually separated to be accurately counted. This applies to moving objects or static (non-moving) objects, say parts in a tray. Sometimes image analysis provides an identifying feature for each object that effectively separates them. For example, the printing on a touching row of cartons might be used to identify each carton. If not we might apply image analysis algorithms to visually separate the objects. For example, two chicken patties might touch at one or a few points and so would be counted as one object rather than two.
Touching parts can sometimes be visually separated using image morphology algorithms. These non-linear operations change the visual shape of an object. They are fundamental to and often used in image analysis. A full description or morphology is well beyond the scope of this article but, with apologies to the experts, here is a simplified version of binary morphology.
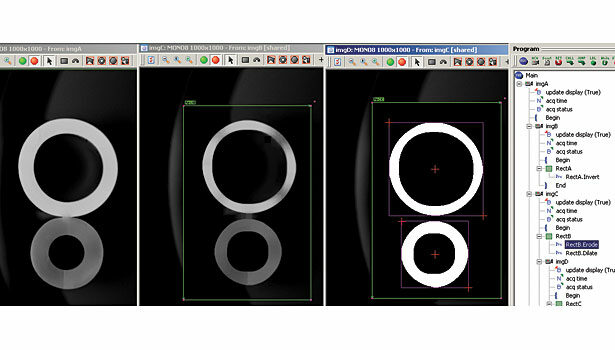
Erosion removes bright pixels from the edges of bright (in the image) objects; dilation adds bright pixels to the edges of bright objects. If the objects are represented by white pixels, as with the chicken patties, each application of the erosion operator removes a shell of white pixels from the object representation.
This breaks apart touching objects. Of course, repeated erosions can cause an object to break into what looks like smaller parts or disappear altogether, so you must experiment to find the proper number of repetitions.
When Morphology Fails
When objects overlap too much or are interlocking, morphology might not be able to separate them. For example, in counting pills (pharmaceuticals) you might have two caplets touching along their long edges and then erosion (or dilation, depending on the part intensity) could make the parts disappear altogether before they are separated. If you know the size of the parts then you can use connectivity (blob) analysis to find the combined area and can know that this represents two or more touching parts. The same issue arises in counting surface-mount components such as capacitors.
If objects overlap the counting problem becomes even harder. This is the classic “bin of parts” problem that has been studied for over 40 years. One possible solution path is to look for junctions between object outlines that have different angles and positions than those found on the part. For example two overlapping bolts will have thread edges that intersect – we hope they don’t mesh! Another approach is to use height or 3-D measurements to find objects at different levels.
Of course, if a part totally obscures another, there is little you can do. Perhaps X-ray vision?
References: