Imagine having a complete toolbox in your garage—one of those big red rolling toolboxes with drawers and compartments everywhere. Every wrench and ratchet, screwdriver and socket is neatly organized and available to be used. Just the right tool for every task.
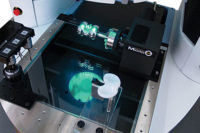
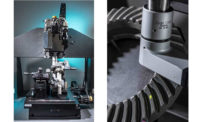
This is the world of modern multisensor measurement. Need speed to measure thousands of small features on a surface? Digital video systems gather thousands of measurement points in fractions of a second. Need high density points to characterize a 3-D surface? High speed laser sensors scan part surfaces down to sub-micrometer uncertainty. Have features that present access problems such as bores or slots? Touch probes, both single point and scanning, are available to probe and scan the most inaccessible features. Need to access features on all faces of a part or features at odd angles? Wrists and rotary tables manipulate the system to create the perfect part/sensor relationship.
TECH TIPSThe move to visual interfaces for the most fundamental steps of automatic measurement area is a giant step forward in truly bringing 3-D multisensor metrology software to the shop floor user. Although 3-D metrology software has closed the gap with current display technology for the moment, there is much more than can and should be done. True three-dimensional, perhaps holographic, displays will eventually become available, opening up new frontiers in 3-D metrology software. |
When you have a complete set of tools, there is virtually no feature dimension that can’t be measured. With a toolbox so well equipped, it’s not work—it’s fun.
How It Began
Multisensor metrology systems have been in use for over 25 years. The world’s first multisensor coordinate measuring system was featured on this magazine’s cover in 1988. Since those early days, multisensor systems quickly evolved to measure full 3-D geometries, combining data from touch probes, scanning probes, point and wide scan lasers as well as a variety of optical/video sensors.
But throughout a quarter century of 3-D multisensor evolution, measurement software itself did not become truly “3-D” in the visual sense—it relied on 2-D video images and 2-D “models” to represent the measured part. It might fairly be said that system and sensor technology out-stripped the ability of software and display technology to conveniently and easily inform and empower the user.
As parts are increasingly designed using 3-D CAD, and the purpose of advanced metrology evolves to “confirm design intent” and perform “what if? analysis” rather than merely offering go/no-go evaluation, it follows that multisensor systems ought to use the original 3-D CAD model as the essential basis for conducting and displaying measurements.
Of course today’s multisensor measuring software does use 3-D CAD models as the basis of measurement projects, but the latest software technology goes a step further in extending the 3-D model concept to other key aspects of the man-machine interface. These new visual interface techniques address the most cumbersome aspects of CMM programming. By creating animated, visual models that let the user see exactly what’s happening “inside” the software, the most difficult aspects of training and start-up experience can be transformed. What once took many days of training now takes new users just a few minutes.
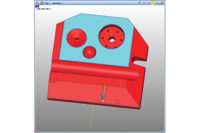
The first of these visual devices is the full multi-axis kinematic display. This model is an animated 3-D view of part and machine with all axes and sensors shown “live.” If the user moves the joystick or deploys a sensor, the model instantly changes to reflect the commanded motion in real time.
The virtual world presented on the kinematic display matches the real world of the machine, including all its sensors and the part being measured. Whether working on-line with the machine or off-line on a stand-alone computer, the kinematic model demystifies the relationships of all the working parts of the system, allowing intuitive and easy interaction. With new metrology software, 3-D animations include the optical field of view, laser capture range and touch probe reach within the measuring volume. The ability to visualize the relationships between optics, sensors and the measured part makes setting up new routines vastly more efficient.
Three-dimensional visual animations can also be used to simplify the most challenging aspect of learning to use a multisensor coordinate measuring system—setting up alignments. Alignments are a difficult concept for new users to grasp, primarily because there is no tangible result of creating an alignment. A stage move or measurement is obvious because there is a corresponding machine action for each programmed step, but datum set-ups have no such obvious action.
That problem is solved using animated alignments to graphically show the coordinate reference frame superimposed on the 3-D part model. The guesswork of creating alignments is eliminated, because there is tangible evidence of the current datum set up shown right on the screen. This real time visual reminder greatly increases the user’s confidence. A user that is not constantly “double checking” to assure him or herself that the system is doing what they want it do lives in a world of lower stress and higher efficiency.
The next area in which 3-D animations are used is in the application of Geometric Dimensioning & Tolerancing (GD&T). Three-dimensional animations show the user all degrees of freedom specified by the feature control frames for all features and datapoints. Now the relationships of nominal features, tolerance zones and datum constraints are shown visually. When datapoints are measured, they are added to the animation, allowing one to easily see the part condition compared to the design.
Another common measurement function which is vastly simplified by using animations are feature constructions. Most parts carry numerous dimensions that are actually distances or relationships between two or more physical features of a part. The measuring system’s sensors measure the features, and the software “constructs” the dimension from them. In many measuring system’s software, constructions are a tedious process involving many—sometimes counterintuitive—steps. Animated constructions make the process obvious—just “point and click” on features in the model to construct their relationship.
Benefits
The benefits of using 3-D animations as the principal user interface scheme in 3-D measuring software are many.
3-D visualization of the measuring system and part gives users complete understanding and confidence in the datum set-up and lets them act intuitively with the measuring system.
Less training is required to begin using the system productively, and users can work with greater confidence.
Shorter time is needed to stage parts and begin programming or measurement.
CAD Model based programming streamlines the verification process, allowing measurements to be compared directly to the original part design rather than an interpretation of the original part model.
Advanced features such as “apply to similar” allow one programming step to be assigned to any or all features in the CAD model which share the same characteristics—effectively leveraging the CAD database to best advantage.
All in all, the move to visual interfaces for the most fundamental steps of automatic measurement are a giant step forward in truly bringing 3-D multisensor metrology software to the shop floor user.
Where do we go from here?
Although 3-D metrology software has closed the gap with current display technology for the moment, there is much more than can and should be done. True three-dimensional, perhaps holographic, displays will eventually become available, opening up new frontiers in 3-D metrology software. We’ll all go back to the drawing board (what’s a drawing board?) to develop even richer, more intuitive user experiences.


