In colorimetric applications, color is measured objectively; therefore, visual color perception should be simulated as precisely as possible with the color measurement systems used.
“Color” here always refers to the color specification, that is, the sensation perceived by the eye as the result of a color stimulus. The objective of the measurement is not the (physical, spectral) color stimulus, but the (effect-producing) color specification.
Two types of instruments are used for color measurement: the spectrophotometer and the tristimulus colorimeter.
The tristimulus colorimeter
A colorimeter uses filters to record the amount of light reflected in three wavelength ranges across the visible spectrum. It includes red, green and blue filters that generally correspond to the 1931 CIE 2° color matching functions x, y and z. These are used to simulate the detectors in the eye. The color matches represented by the filters depend on the physical light used. Because of this, a colorimeter can produce a tristimulus notation only for one light (the measurement light) and for one observer condition (which is simulated by the filters used by the instrument).
Tristimulus colorimeters are mainly used in quality control and are reliable for evaluating color differences and color tolerance checks. However, a tristimulus colorimeter cannot detect metamerism, and is not used to calculate color formulas.
The spectrophotometer
Spectrophotometers analyze the light reflected or transmitted by a sample at each wavelength in the visible spectrum, compared to that from a reference sample. They are fitted with a device, typically a diffracting element, which breaks the incident light into individual wavelengths. The resulting data are referred to as spectral data. Spectral data are an independent, relative measurement of an object that serves as a fingerprint of the color. This data never changes for the object, and can be used in several different ways.
A single measurement of the object can be used to calculate the tristimulus values of a color for a variety of illuminant/observer conditions.
Because it can project the tristimulus values for multiple illuminant/observer conditions, it can be used to identify whether samples are metameric to one another.
The data can be used to evaluate color differences between samples and to calculate color recipes for commercial color matching applications.
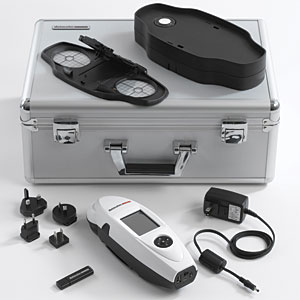
Spectrophotometers are simple and fast to operate. Thanks to technological development, these instruments continue to become lighter in weight, making them portable. In addition, prices of industrial spectrophotometers have become quite competitive with traditionally lower-priced tristimulus colorimeters.
The technology of the instruments
Three components are required to generate a numerical description of color: light, object (sample) and the observer (eye and brain).
The light source
The light source is located in the instrument. Modern instruments for measuring color generally use one of three types of light source: halogen, xenon or LED lamps. They are fitted with a filter to simulate the spectral power output of daylight.
The sensor
The human observer is simulated by a light detector. The “eye” of the color measurement instrument depends on the type of instrument. The configuration of the sensor depends on whether a colorimeter or spectrophotometer is used.
The object (the measurement geometry)
The perceived color of an object depends on the illumination and viewing conditions used. The same object can generate different perceptual experiences of color depending on the angle at which an object is either illuminated or observed. Color measuring instruments are configured to simulate a fixed, specific angle of sample illumination and sample viewing. The measurement geometry uses two angles to identify the conditions, for example d/8°. The first angle identifies the angle of illumination and the second angle defines the angle of viewing.
Measurement instruments with angle geometry (45°/0°) use targeted illumination of the sample at an angle of 45° and measure the light reflected by the sample in one direction at 0° (or conversely 0°/45°).
Measurement systems with this measurement geometry observe the sample under conditions similar to those of natural observation by a human. This means that measurements with the angle geometry (45°/0° or 0°/45°) are always taken with the gloss excluded, and therefore result in closer equivalence to the eye’s visual impression. This geometry is predominantly used in color control for end products.
Measurement instruments with sphere geometry (d/8°) illuminate the sample diffusely and measure the light reflected by the sample in one direction at an angle of 8° to the vertical position of the sample. When using a sphere instrument, the specular component may be included or excluded from the measurement. Specular means ‘mirror-like.’
Specular reflection is regular; the angle of reflection equals the angle of incidence. The measuring condition you choose depends on your goal regarding differences in sample surfaces. Specular Component Included (SCI) lighting includes all reflected light regardless of its angle and obscures surface differences. Specular Component Excluded (SCE) lighting enhances these surface differences.
The d/8° geometry is used almost exclusively in applications that require color formula calculations. Most instruments with d/8° geometry also offer the option of measuring the transmission behavior of transparent or translucent samples.
Conclusion
In the last decade, significant advances have been made in the development and production of color measurement systems. In comparison with the instruments available previously, today’s modern systems enable reliable measurements with higher accuracy and precision. They are also smaller, lighter and faster. They can be used to measure different sample types, they are more flexible processing data, easy to operate and frequently less expensive than ever before. The latest color measurement technologies enable communication with digital standards, meaning that the precision of these measuring instruments is so high that virtually no relevant deviation can be detected from one device to another.


