Quality Magazine logo
search
cart
facebook twitter linkedin youtube
  • Sign In
  • Create Account
  • Sign Out
  • My Account
Quality Magazine logo
  • NEWS
  • PRODUCTS
    • FEATURED PRODUCTS
    • SUBMIT YOUR PRODUCT
  • CHANNELS
    • AUTOMATION
    • MANAGEMENT
    • MEASUREMENT
    • NDT
    • QUALITY 101
    • SOFTWARE
    • TEST & INSPECTION
    • VISION & SENSORS
  • MARKETS
    • AEROSPACE
    • AUTOMOTIVE
    • ENERGY
    • GREEN MANUFACTURING
    • MEDICAL
  • MEDIA
    • A WORD ON QUALITY PUZZLE
    • EBOOKS
    • PODCASTS
    • VIDEOS
    • WEBINARS
  • EVENTS
    • EVENT CALENDAR
    • IMTS
  • DIRECTORIES
    • BUYERS GUIDE >
      • Supplier Insights
    • NDT SOURCEBOOK
    • VISION & SENSORS
    • TAKE A TOUR
  • INFOCENTERS
    • Digital Quality Management Systems
    • NEXT GENERATION SPC & QUALITY ANALYTICS
  • AWARDS
    • ROOKIE OF THE YEAR
    • PLANT OF THE YEAR
    • PROFESSIONAL OF THE YEAR
  • MORE
    • Expert Columns
    • NEWSLETTERS
    • QUALITY STORE
    • INDUSTRY LINKS
    • SPONSOR INSIGHTS
  • EMAG
    • eMAGAZINE
    • ARCHIVES
    • CONTACT
    • ADVERTISE
  • SIGN UP!
Test & Inspection

Sweat the Details during Product Testing to Prevent Costly Mistakes

A statistics-based risk assessment program enables the necessary balance between ensuring an effective test and inspection process and speed to market.

By Kent Wang
Test Inspection
Test Inspection
QM1016-FT2-TestInspection-p3-VendorA.jpg
Test Inspection
Test Inspection
Test Inspection
QM1016-FT2-TestInspection-p3-VendorA.jpg
Test Inspection
October 1, 2016

The scope of product testing is growing broader and more complex. Traditionally, the objective was to confirm compliance with relevant safety regulations. But today we’re seeing more product management teams also push for functionality and reliability testing. They want to ensure the product is not just safe for consumers to use, but that they will enjoy using it. After all, the impact to a company’s brand reputation and bottom line can be severe if it cannot discover a defect or other problem before the manufacturing process is complete. Therefore, the challenge is how to conduct more thorough testing without delaying the production process or impacting the delivery plan. A statistics-based risk assessment program enables quality managers to strike that necessary balance between ensuring an effective test and inspection process and speed to market.

As its name suggests, a statistics-based risk assessment program is one that assesses quality risk based on an analysis of historical data. For example, a manufacturing facility that has a track record of producing products with defects or other errors, or working with a facility that will produce your product for the first time, increases the risk. But that is just the tip of the proverbial iceberg. Thorough pre-production testing can look at any number of a product’s features and functionalities and leverage statistical analysis to identify problems before the assembly lines start moving. 

Tech Tips

  • A statistics-based risk assessment program is one that assesses quality risk based on an analysis of historical data.
  • For example, a manufacturing facility that has a track record of producing products with defects or other errors, or working with a facility that will produce your product for the first time, increases the risk.
  • Thorough pre-production testing can look at any number of a product’s features and functionalities and leverage statistical analysis to identify problems before the assembly lines start moving.

Consider the production of a new model of smartphone, which have become powerful minicomputers that are users’ primary tools for browsing the internet, getting work done, taking and sharing photos, and listening to music, among dozens of other tasks.

Poor initial reviews by journalists, bloggers and early adopters will doom sales. Therefore, companies want the inspection and testing process to address more than whether the device powers on and can make/receive calls clearly. They want to address the typical consumer’s expectations of quality: usability, aesthetics (i.e., does it “look good”), performance, reliability and compatibility with their ever-growing collections of Internet of Things (IoT) devices.

The category of reliability alone should include a long list of tests, including:

  • Bending and strain relief
  • Cable plugging and unplugging
  • Static pull
  • Button/knob press
  • Electrical static discharge
  • Salt water spray
  • Speaker life
  • Bare unit drop test
  • Coating, painting and adhesion

Conducting statistics-based tests for all of these areas will not only identify defects that are immediately apparent, but anticipate potential problems months from now.

Consider the device’s power button that not only powers it on and off, but also enables the user to just turn the screen display on and off. It may initially respond quickly and accurately to a finger press, but how will it hold up as the user presses it repeatedly day after day? Determining the answer requires testing before and after manufacturing.

There are five phases that virtually all new devices go through:

  1. Ideation and concept: Conceive a new product and conduct market and feasibility analyses.
  2. Definition and design: Develop the product’s design and features.
  3. Development: Convert the design concept into a working prototype.
  4. Production: Turn one prototype into large volumes of the final product.
  5. Distribution: Deliver the finished products to distributors and retail outlets.

Let’s stay with the example of testing the smartphone’s power button. You must begin the testing process during phase 2 by first quality requirements and specifications for the button over long-term usage, such as after 1,500 cycles.

Begin conducting the actual testing when you move to phase 3 – development. Test the working sample’s power button life and ensure it is performed no less than the established 1,500 cycles threshold.

Once you’re ready to begin the production phase, take steps to ensure the manufacturing process is consistent by regular monitoring and validate button life by conducting regular spot testing.

Even when the manufacturing process is complete, the testing process is not. During the distribution phase, validate each order’s overall quality prior to shipping. Continue to monitor quality throughout the entire manufacturing process to ensure the power button’s materials and component have not changed since its engineering specs were approved. And that’s all just to ensure the power button meets users’ expectations. This process applies to all usage reliability and environment reliability tests.

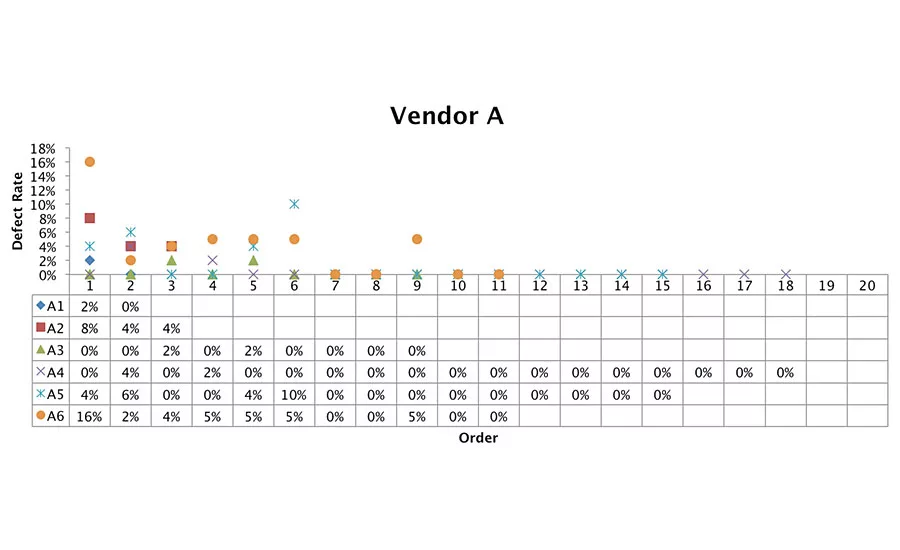
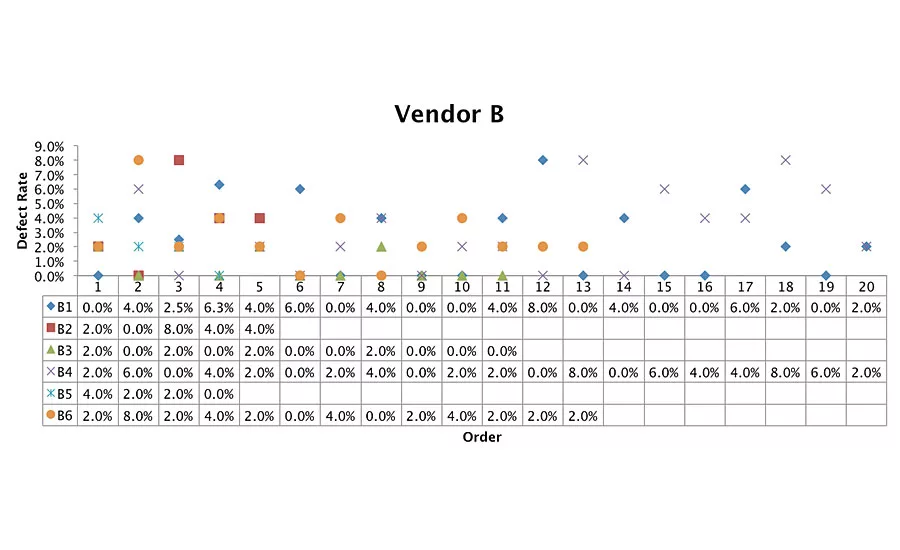
These two charts show just how costly the traditional approach of limiting testing only to confirm compliance with safety regulations has become.

The chart of Vendor A shows that testing revealed high defect rates in the initial production batches. The statistics alert the quality manager to a problem related to design or engineering. He halts the process so that issue is addressed before mass manufacturing beings. Consequently, the defect rate falls and remains flat.

The chart of Vendor B reflects a production process that does not include inspection and testing before mass production. The quality manager cannot identify any trends pointing to a problem, and so the defect rate remains unacceptably high. 

Taking a statistical analysis approach to testing will enable you to detect issues before manufacturing begins. This will enable you to consider re-allocating resources to address these priority areas as necessary. It may sound time-consuming and costly, but consider the much higher amount of money and time you will have to devote to fixing a problem after manufacturing ends.

Picture a seesaw on the playground with prevention cost on one end, and failure cost on the other. Prevention cost represents only the outlay for outsourcing testing before, during and after manufacturing to an outside expert service. But failure cost includes the burden of high return and exchange rates, poor customer ratings that damages your brand, and the high warranty cost per unit for repairs and replacements. On the seesaw, the failure cost is much heavier. 

KEYWORDS: failure costs statistical analysis

Share This Story

Looking for a reprint of this article?
From high-res PDFs to custom plaques, order your copy today!

Kent Wang is the manager of Integrated Quality Solutions (CTS) at SGS USA. He has more than 20 years of experience in quality management, spanning through entire product lifecycles and business processes. He has also worked across industries of manufacturers, specialty retailers and third party quality services. For more information, email [email protected] or visit www.sgs.com.

Recommended Content

JOIN TODAY
to unlock your recommendations.

Already have an account? Sign In

  • 2024 Quality Rookie of the Year Justin Wise 1440x750px banner with "Quality Rookie of the Year" logo inset

    Meet the 2024 Quality Rookie of the Year: Justin Wise

    Justin Wise is an exceptional individual who has been...
    Aerospace
    By: Michelle Bangert
  • Man with umbrella and coat stands outside while it rains at night looking at a building.

    Nondestructive Testing: Is there an ethics problem?

    I was a whistleblower who exposed fraudulent activities...
    NDT
    By: Dale Norwood
  • Unraveling Deflategate: Football stadium with closeup of football on field

    Unraveling the Tom Brady Deflategate

    The Deflategate scandal erupted following the 2014 AFC...
    Measurement
    By: Greg Cenker and Henry Zumbrun
Manage My Account
  • eMagazine Subscriptions
  • Newsletters
  • Online Registration
  • Subscription Customer Service
  • Manage My Preferences

More Videos

Sponsored Content

Sponsored Content is a special paid section where industry companies provide high quality, objective, non-commercial content around topics of interest to the Quality audience. All Sponsored Content is supplied by the advertising company and any opinions expressed in this article are those of the author and not necessarily reflect the views of Quality or its parent company, BNP Media. Interested in participating in our Sponsored Content section? Contact your local rep!

close
  • Key Takeaways for Quality Leaders
    Sponsored byComplianceQuest

    Key Takeaways for Quality Leaders from the 2026 Gartner Magic Quadrant™ for QMS

  • This image shows a person seated next to a Bobcat T66 compact track loader.
    Sponsored byPolyWorks by InnovMetric

    Supercharging Digital Gauging at Bobcat North America

  • Dorsey Calibration Lab photo by Tom LaBarbera Picture this Studios
    Sponsored byDorsey Metrology International

    Ensuring Product Quality in a Competitive Manufacturing Landscape

Popular Stories

iStock-1352825159-jpg.jpg

U.S. Should Substantially Boost Support for Manufacturing USA Program, Issue National Industrial Manufacturing Strategy, Says New Report

Dorsey Calibration Lab photo by Tom LaBarbera Picture this Studios

Ensuring Product Quality in a Competitive Manufacturing Landscape

Visions Sensors Ebook

eBook | How AI-driven Vision Systems Are Transforming Automotive Quality Control

2026 Quality Professional of the Year!

Events

June 22, 2026

Automate 2026

Automate is North America's largest robotics and automation event — and the best place to take your ideas from insight to impact.
 
Our show floor features the world’s leading automation solutions, from AI and robotics to motion control, vision systems, and more. Plus, our educational conference is second to none, led by the brightest minds in automation today.
 
Ready to transform the way you work? Take the next step at Automate.
July 14, 2026

Quality Leaders Forum: Better Communication, Better Quality Data

The Quality Leaders Forum is a quarterly, editor-moderated fireside chat series hosted by Quality Magazine, featuring candid conversations with senior manufacturing and operations executives shaping enterprise-level quality.

View All Submit An Event

Products

Lean Manufacturing and Service Fundamentals, Applications, and Case Studies

Lean Manufacturing and Service Fundamentals, Applications, and Case Studies

See More Products
Quality Podcast Channel Custom Content

Related Articles

  • Face of Quality: Team Up to Prevent Mistakes

    See More
  • An example of peel testing with manual grips

    The Devil is in the Details: Choosing a Proper Grip for Tensile Testing

    See More
  • This image shows a person working in a laboratory setting with specialized equipment.

    When Milestones Lie: Why Medical Device Teams Fall Out of Alignment and How to Prevent It

    See More

Related Products

See More Products
  • louis hannigan.jpg

    The Non-Idiot's Guide to ISO 9001:2015: Understanding and Using the Quality Management System Standard to your benefit

See More Products

Related Directories

  • TEST NDT LLC

    NDT Training Courses for the Aircraft Industry, consulting and Level III services. Methods include Ultrasonic, Phased Array, Eddy Current, Eddy Current Array, Radiography, Penetrant, Magnetic Particle and Visual. Scheduled and On-Site Training available. Call Cathy Harvey at (714) 255- 1500 for details or to discuss your options.
  • Benz Testing Instruments

    Benz manufactures instruments to test the physical properties of materials. Low temperature brittlepoint of elastometers to test tube aging ovens are some of the products we produce.
×

Stay in the know with Quality’s comprehensive coverage of
the manufacturing and metrology industries.

Newsletters | Website | eMagazine

JOIN TODAY!
  • RESOURCES
    • Advertise
    • Contact Us
    • Directories
    • Manufacturing Division
    • Store
    • Want More
  • SIGN UP TODAY
    • Create Account
    • eMagazine
    • Newsletters
    • Customer Service
    • Manage Preferences
  • SERVICES
    • Marketing Services
    • Market Research
    • Reprints
    • List Rental
    • Survey/Respondent Access
  • STAY CONNECTED
    • LinkedIn
    • Facebook
    • YouTube
    • X (Twitter)
  • PRIVACY
    • PRIVACY POLICY
    • TERMS & CONDITIONS
    • DO NOT SELL MY PERSONAL INFORMATION
    • PRIVACY REQUEST
    • ACCESSIBILITY

Copyright ©2026. All Rights Reserved BNP Media, Inc. and BNP Media II, LLC.

Design, CMS, Hosting & Web Development :: ePublishing