Using EBSD for Improved Quality Process in Metallurgy
Materials development, methods development and quality assurance benefit from the technique.
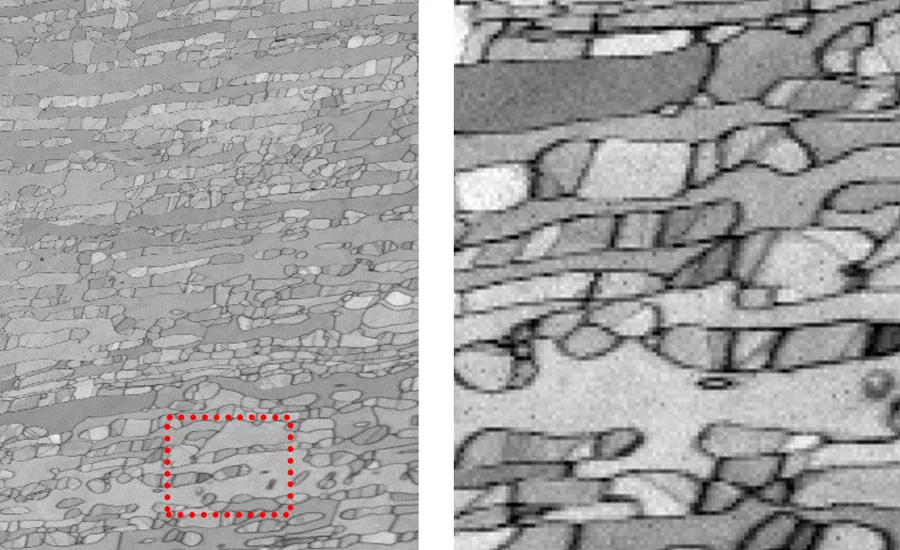
Figure 1 - EBSD pattern quality maps for a duplex steel at low (left) and high (right) magnifications.

Figure 2a EBSD analysis of a duplex steel: orientation distribution of ferrite.
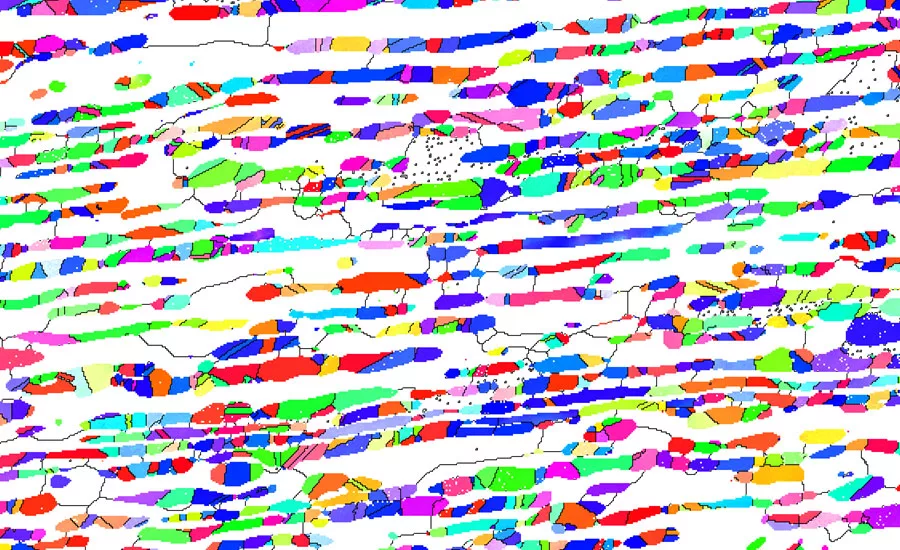
Figure 2b EBSD analysis of a duplex steel:orientation distribution of austenite.

Figure 2b EBSD analysis of a duplex steel: phase distributions of ferrite (dark brown brown) and (austenite (light brown).
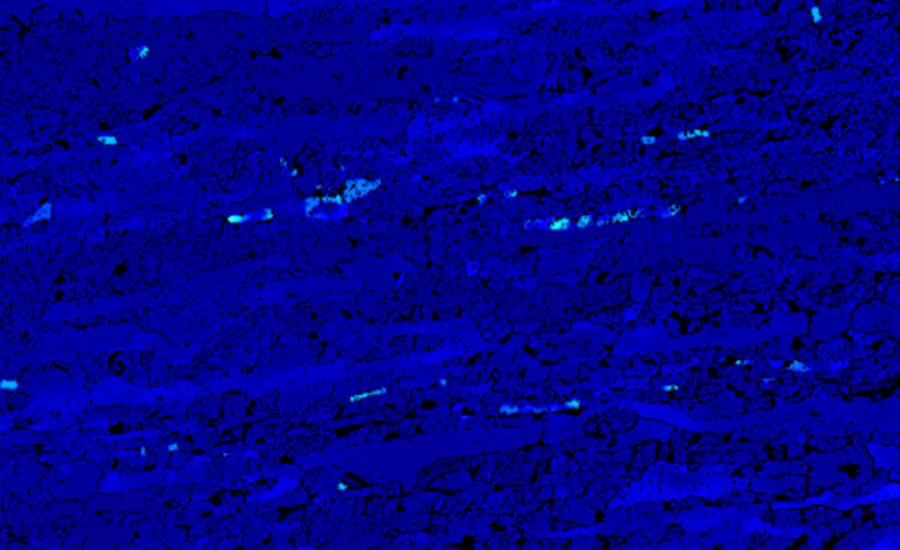
Figure 2 EBSD analysis of a duplex steel: strain analysis across the duplex.
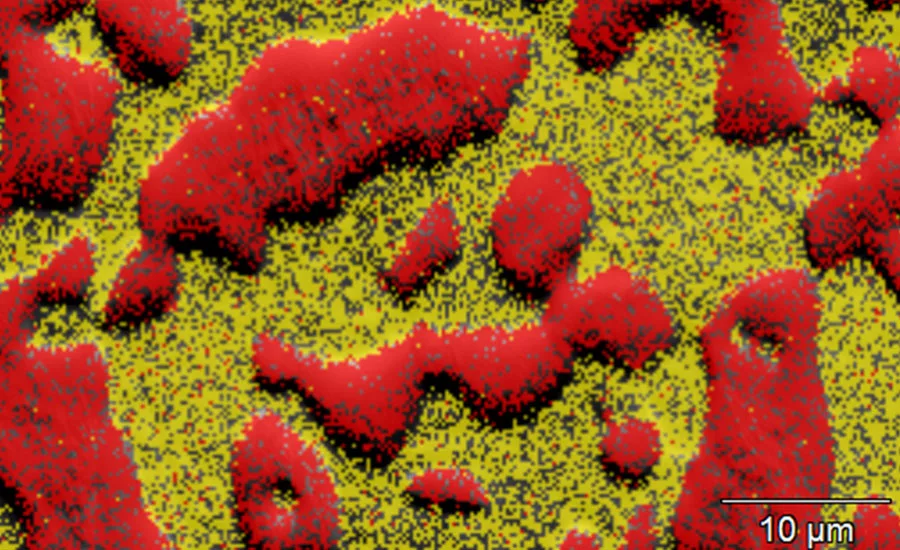
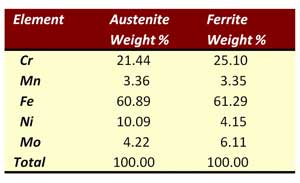
Figure 3. High magnification EDS phase maps for Austenite (red) and Ferrite (yellow) phases within the Duplex.
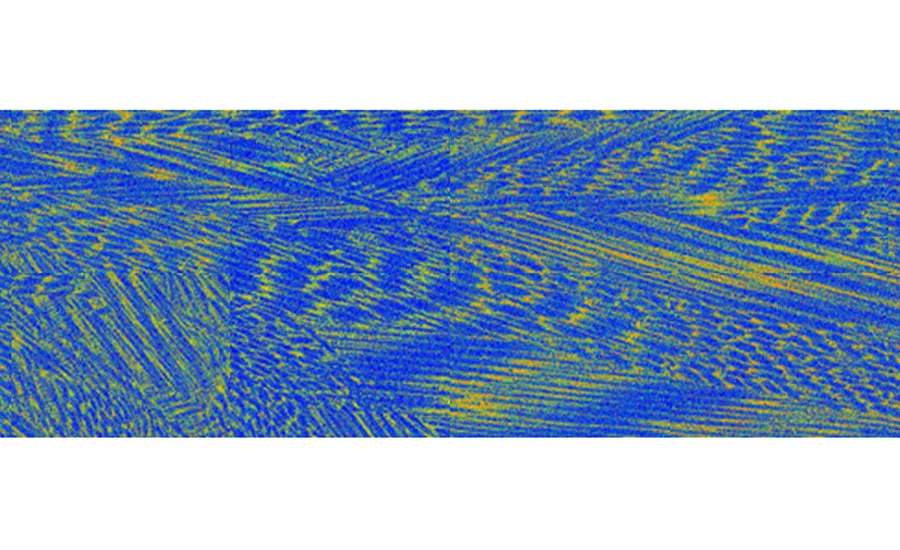
Figure 4. COMPASS EDS phase maps: Phase 1, BCC.
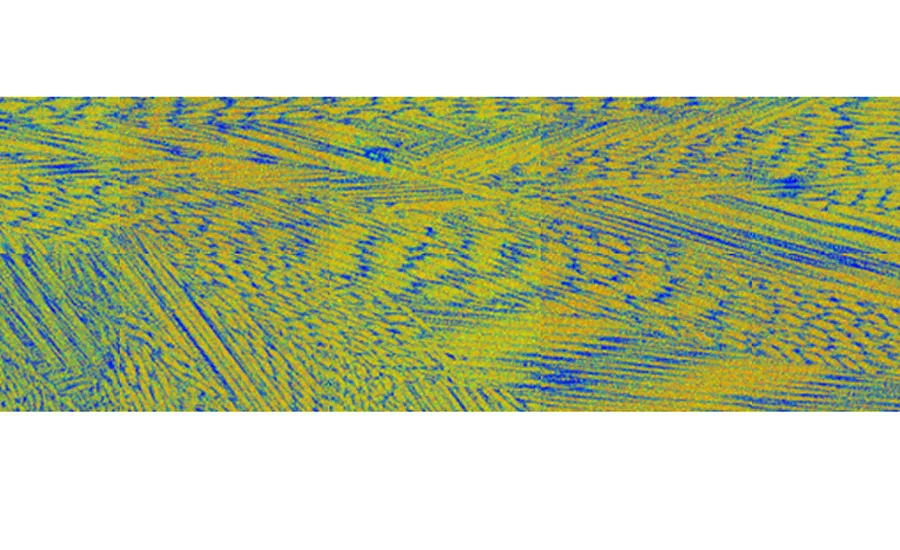
Figure 4. COMPASS EDS phase maps:Phase 2, FCC.
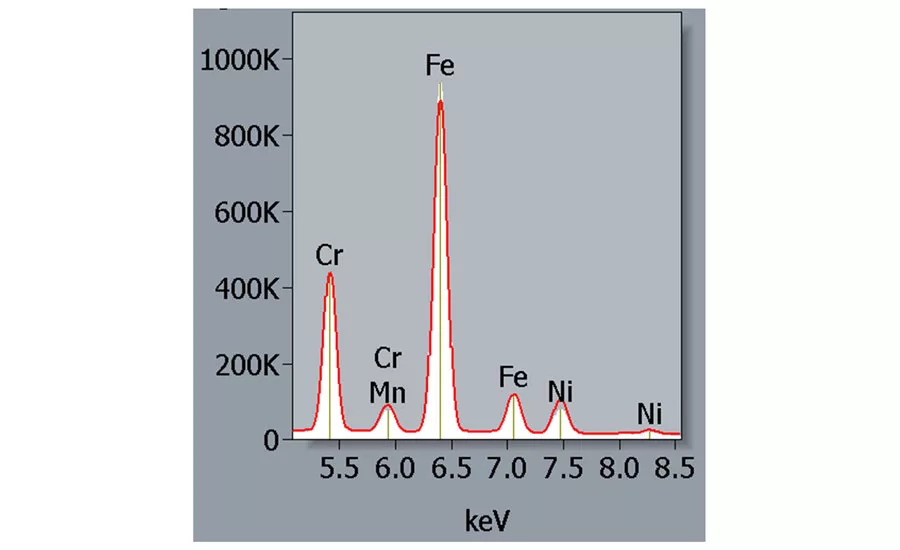
Figure 4c. EDS Spectral of phase 1 and phase 2.
Electron backscattered diffraction (EBSD) is a technique for determining the near surface crystallographic and microstructural properties of a material. It is based on the automated capture and analysis of diffraction patterns formed when a sample is excited by an electron beam within a scanning electron microscope (SEM). This type of analysis is of particularly high value in metallurgy: new materials discovery, process development and quality control of existing processes.
While the roots of EBSD in a SEM go back 30 years, the advent of high performance cameras, increased computational power and automated analysis routines has driven a recent boom in applications across materials science and quality control. Compared to other structural analysis techniques, EBSD has significant advantages: faster, less costly and less onerous sample preparation than electron diffraction in a transmission electron microscope (TEM) and with a spatial resolution many hundreds of times greater than X-ray diffraction. Modern EBSD systems are now fast and versatile, yielding rich quantitative datasets in 2D and 3D with sub-micron resolution and with most analyses of metallurgical samples completed in less than 20 minutes.
There are three main operational modes of EBSD, each with differing requirements for sample preparation and analysis procedures:
- Orientational image mapping (OIM) provides the crystallographic orientation and diffraction pattern quality of a polycrystalline material across the sample with many tens to several hundreds of grains per map. The onus for mapping is therefore on speed of acquisition with exposure times of a few milliseconds. Once collected, these data sets are interrogated using grain reconstruction algorithms to assess the microstructure of the material.
- Phase identification involves the determination of unknown phases through the comparison of diffraction patterns against a database of many thousands of known phases. An example application would be in corrosion science which investigates the transformation between the iron oxide phases of hematite (Fe2O3) and magnetite (Fe3O4).
- Strain analysis uses cross correlation of diffraction patterns to show changes and defects within the crystal lattice. This analysis method has the highest angular precision and is increasingly used in predictive failure analysis.
The increasingly faster speeds of analysis imply that EBSD-OIM may serve as an increasingly practical and valuable tool in metallurgical quality control with a focus on continuously monitoring the microscale. The basic nature of EBSD—electron beam on sample—inherently supports the simultaneous use of energy dispersive spectroscopy (EDS) for concurrent chemical analysis of the material.
By way of example, Fig. 1 shows an example of OIM and the information content available to the user. The case study involves the analysis of a duplex steel, containing approximately equal amounts of ferrite (BCC) and austenite (FCC) grains. Of particular interest is the grain sizing, distribution and inter-orientation grain relationships between the ferritic and austenitic phases as this gives insight into the ductility and stress resistance within the material.
The samples were analyzed with an EDS detector and an EBSD camera. EDS phase mapping was performed using a principal component analysis technique, as developed by Paul Kotula at Sandia National laboratory [1, 2] and employed in a phase mapping software package. Maps were acquired at 20 kV accelerating voltage with 1024 x 768 pixels and a 0.5 micrometer step size and exposure time of 1.5 ms, meaning the analysis time was approximately one hour.
Interpretation of the data begins with band contrast imaging, Fig. 2a, which gives a measure of the quality of the diffraction pattern at each pixel and is therefore related to the underlying crystallinity. Grain boundaries and defects typically yield low quality diffraction patterns as represented by darker pixels, while the overall contrast of individual grains is related to the grain orientation. The enlarged image, Fig. 2b, shows the distribution of grains across the sample: there are distinct types of grains, one with large continuous features and another made up of smaller twin grains, signified by the straight-lined grain boundaries.
Probing the data further, a phase plot, Fig. 2, reveals that the larger grains are ferrite and the smaller grains are austenite. The orientation maps for ferrite, Fig. 2a, reveal large, continuous grains without a preferred orientation. The distribution of austenite, Fig. 2b, shows a high number of twin boundaries within these grains. Overall, there was no relationship observed between the orientations of the austenite and ferrite phases. Figure 2c is a plot of the average orientation of each point in the grain relative to the average for the grain. Figure 2d shows the strain analysis across the material.
High magnification EDS phase maps were generated as described earlier and displayed in Fig. 3. The red and yellow EDS phase maps correlate neatly with the austenite and ferrite phases identified with EBSD. Cr and Mo are ferritic stabilising alloying elements. A quantitative analysis of the software phase maps indicates a 4% increase in Cr and 2% increase in Mo—at the expense of Ni—in the ferrite phase relative to the austenite phase. While subtle, this difference is sufficient to define the two unique crystal structures.
It is evident that the concurrent collection of EBSD and EDS data provides an additional level of information that is not available when employing only a single technique and that the combined data streams generate the statistical data required for process and quality control on the microscale. However, one may argue that both streams of information are not necessary in many analytical use cases. When one technique has clear practical use-case advantages over the other and if the information from one technique can be successfully correlated against the information from the other technique, it may be worthwhile to intentionally omit one of the two techniques.
In the case reviewed here, EDS has a shorter time to answers (5-10x faster), less rigorous sample preparation requirements and a preferred analytical geometry (flat vs. tilted) relative to EBSD. Here, it has just been demonstrated that both EDS and EBSD phase maps can be generated and correlated to each other. It is therefore reasonable to assert that EDS phase maps—at least as generated with the software algorithms described here—are sufficient to infer the crystal structure, sizing and distribution of grains within the metal that would otherwise have been obtained with EBSD. The detailed orientation information on the grains is lost without the EBSD. However, this is balanced against the value that much larger sections of the material may be analyzed—such as for quality assurance and quality control purposes—and likely done so in a shorter amount of time.
This concept of large area quantitative phase mapping is demonstrated on a sample of stainless steel 304 that underwent rapid heating and cooling during a welding operation. The weld was performed in the transverse direction (left to right) shown here. EBSD and EDS had previously been used to determine that the BCC ferrite phase had between 7.5% - 8% Ni. As the metal cooled, Ni was rejected from the ferrite, and FCC austenite with approximately 10% - 11% Ni formed in the boundaries between the ferrite grains. An EDS-only acquisition was then performed over a large area of the sample and phase maps of the elemental distribution were generated using the software’s PCA algorithms. The region of steel studied was 5.5 mm long by 0.65 mm tall. This compares to the previous study that covered an area of 0.5 mm wide by 0.5 mm tall.
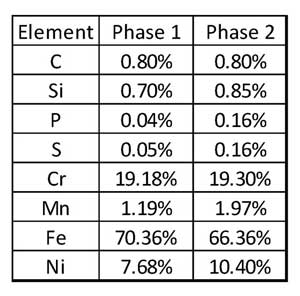
The resulting EDS software phase maps are shown in Fig. 4a and Fig. 4b. The two dominant components (i.e. chemical phases) are immediately apparent. The EDS spectra extracted from each phase and overlaid on each other are shown in Fig. 4c. The two spectra are nearly identical with only small differences in the EDS peak intensity of Ni and Fe. The quantitative results, Fig. 3d, demonstrate that phase one, with 7.68% Ni, is BCC while phase two, with 10.4% Ni is FCC.
Using this correlative approach, the FCC and BCC phases, including grain size and distribution, were effectively determined without the need to run concurrent EBSD. The details regarding the orientation of the BCC and FCC grains are not obtained. However, the ability to analyze a region roughly 15 times larger while maintaining sub-micron resolution provides both the fine detail of the material structure and the broader overview needed to both see the “bigger picture” of information in the sample and to sample a large enough number of grains for proper statistical analysis of the grain structure. For example, the grains identified here are long, thin and aligned with the direction of the weld.
Conclusion
Both EBSD and EDS are valuable tools for monitoring the microstructure of metallurgical samples. The decision on whether to utilize either one technique as stand-alone or both techniques simultaneously depends on the information type—i.e. quantity vs. quality—required. Detailed grain orientation requires only EBSD. Correlation of crystal structure to materials chemistry requires both EBSD and EDS. General quality control of grain size and distribution via chemistry required only EDS. Materials development, methods development and quality assurance/control benefit from both techniques as the use-case requires.
1. Keenan, M.R. & Kotula, P.G. (2003) Apparatus and System for Multivariate Spectral Analysis, Sandia National Laboratories, USA. Pat. 6,675,106 B1. 24 June 2003.
2. Keenan, M.R. & Kotula, P.G. (2004) Method of Multivariate Spectral Analysis, Sandia National Laboratories, USA. Pat. 6,675,106 B1. 06 January 2004.
Looking for a reprint of this article?
From high-res PDFs to custom plaques, order your copy today!


