Fully Characterizing Brake Pad Materials to Improve Performance and Lower Development Costs
Combining benchtop mechanical testing of smaller brake material samples with rapid 3D surface metrology makes it possible to analyze results more quickly than ever before.

Figure 2. A 3D optical view of a worn brake pad coupon after tribology testing. The color map overlay reveals differences of reflectivity in the material components.
Researching how different materials influence brake pad performance and durability involves a vast amount of back-and-forth testing and metrology analysis. Brake materials that seem to be good candidates for improved braking or that can meet ever more stringent environmental regulations are typically evaluated first by metrology analysis, then by dynamometer tests, which simulate the real-world conditions necessary to stop a vehicle. Materials that pass these steps then go through extensive on-vehicle stopping tests that require the brake pads and rotors are in their final form. Clearly this is a very necessary but complex and cost-intensive process for brake manufacturers. Anything that can help streamline these requirements is of intense interest to the industry. This article discusses how combining benchtop mechanical testing of smaller brake material samples with rapid 3D surface metrology makes it possible to perform many of the pre- and post-test analyses more quickly and cost-effectively than ever before.
Testing Brake Materials
Development of new materials for automotive brake applications comes with many challenges, including formulation of materials that meet expected (usually more demanding) performance; that enable reduction in manufacturing cost; and that provide compliance with any new safety and environmental regulations. Brake materials are typically evaluated prior to on-vehicle stopping tests by a full-scale dynamometer. Dynamometers allow testing of the real pads and/or rotors under protocols simulating the conditions necessary to stop a vehicle. Different standards have long been in prevalent use by this specialized industry, such as the SAE J2522 developed by the AK Working Group, which represents European manufacturers of passenger car brakes. This test was developed to evaluate the effectiveness of the brake pad and the rotor system under varying conditions of pressure, temperature, speed, and deceleration.
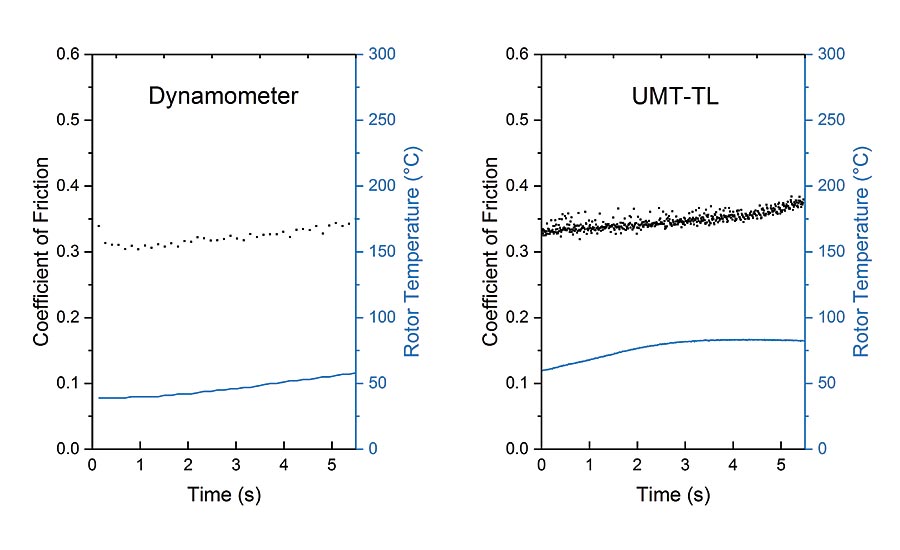
Figure 1. Comparison of a the SAE J2522 – 6.6 cold application test on a dynamometer (left) shows good correlation with benchtop TriboLab test (right).
To perform any relevant test on the dynamometer, it is necessary to manufacture the rotor and pad in the exact shape and size as a final product. Thus, it is a costly method, without even accounting for the time needed to prepare materials and the queue time in accessing available dynamometers. Additionally, to perform the tests, it is necessary to include other elements of the brake system that can introduce further variables. For example, the effectiveness of the caliper can vary depending on design, making it difficult to separate the effect of the brake and rotor.
There has been a long-standing need in the industry for a technique that can provide faster screening in the early stages of brake materials development, before the more laborious and expensive testing at the component level on a dynamometer. New mechanical testing technology now exists that allows a more rapid and cost-effective means to test potential materials for automotive brake applications, reducing the extent of dynamometer testing required. Benchtop testers utilize small sample coupons made of candidate friction materials, and test them against industry-standard dynamometer protocols and specifications. Since benchtop systems typically have small inertia in comparison with a vehicle or dynamometer, deceleration is simulated by controlling the velocity of the motor as a function of time. Key parameters monitored during the different steps of the simulation include torque, coefficient of friction, temperature of the rotor and pad, and sliding speed.
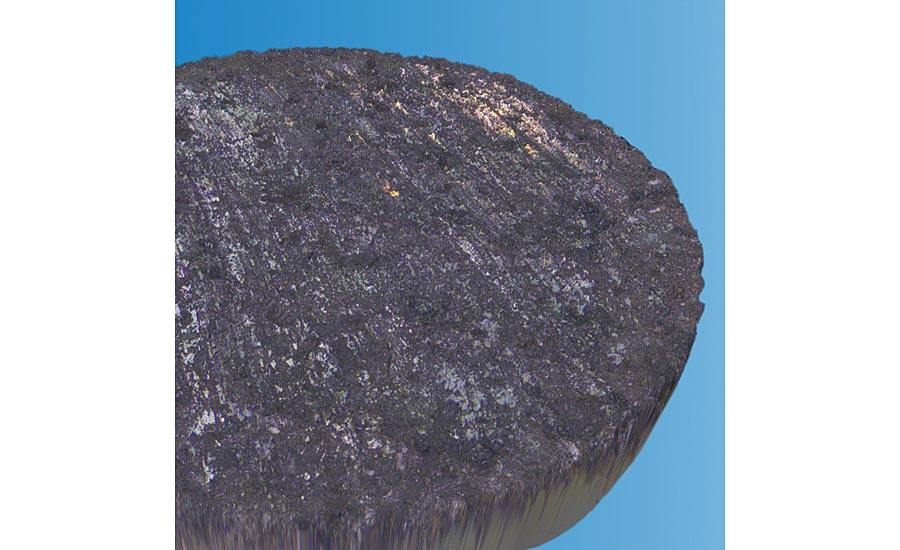
Figure 2. A 3D optical view of a worn brake pad coupon after tribology testing. The color map overlay reveals differences of reflectivity in the material components.
The minimum contact size of the coupons is very important in benchtop friction material testing. While the contact pressure and sliding speed can be selected from the real application or test protocol, there is a minimum sample size that can represent the non-homogeneous morphology and composition of the brake pad. Extensive research has now been done to find this limit, and data collected during the tests show very good correlation between the full-scale and benchtop tests, not only from the calculated average CoF, but also in the behavior of the torque with similar trend and shape (see Figure 1).
Another key advantage of performing the tests at a smaller scale is not only the possibility to easily control environmental parameters, such as relative humidity and temperature, but also the capability to collect the debris ejected from the sliding contact interfaces during the test. Such brake wear particles can then be subjected to post-test chemical and physical characterization for even more detailed information about the materials under consideration.
Measuring and Analyzing the Results
However, physical testing is only one part of the characterization process for brake pad materials. Full analysis by a reliable metrology system provides the additional necessary information to make quantifiable decisions. There are many metrology technologies that can provide accurate surface analysis, but optical profiling using focus variation is particularly well suited to brake materials. Benchtop focus variation profilers can rapidly capture surface data with a large field of view at vertical scanning speeds up to five millimeters per second. Data-rich images are displayed in high-resolution and in real color within seconds. The raw measurement data these systems provide also allow the operator to see exactly what is on the surface without filtering or data modification.
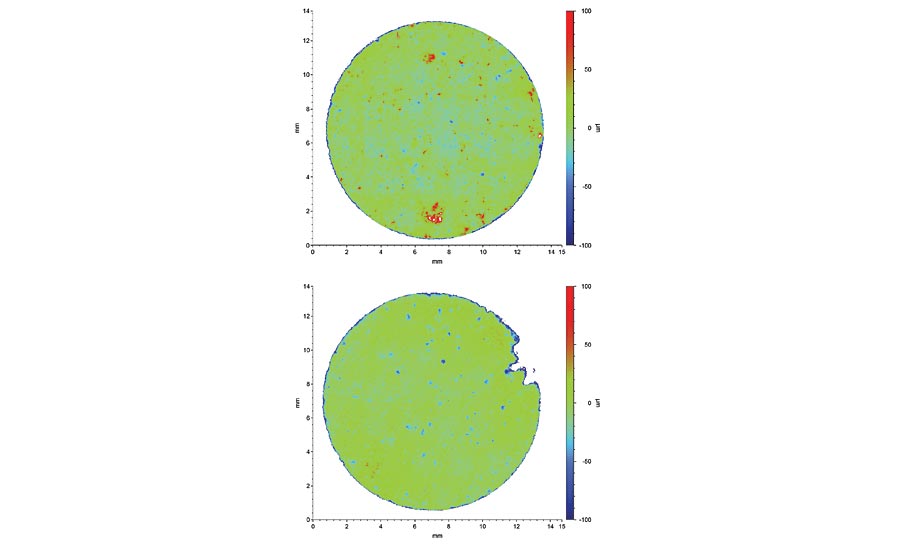
Figure 3. A comparison of brake pad material before (top) and after (bottom) wear testing utilizing the exact same lateral and vertical scale reveals measurable effects of tribology.
Focus variation continuously captures intensity images as the objective is moved toward the sample. When the scan is complete, the software looks at the data for each pixel from every frame to select the frame in which that pixel shows the optimum focus. Knowing the frame this pixel is in, and how far the objective was from the surface when that frame was taken, indicates the surface feature height at that pixel. This process is conducted for each of the pixels in the image (over 1,000,000 points) to build a 3D map, as well as an all-in-focus color image (see Figure 2). Once captured, the data can be fully analyzed with software.
Figure 2 shows an image of a brake test pad after testing. The image surface texture clearly indicates the sliding direction, and wear damage is easily observed. The color image also reveals metallic debris from the brake pad composite material, which can help establish a correlation between material properties and the damage.
Perhaps more importantly, the accuracy of the brake test can be further improved by comparing the pad surface before and after the test (see Figure 3). Three-dimensional surface metrology provides clear evidence on whether theoretical assumptions of flat-on-flat conformation match reality. For instance, potential curvature of a new part can potentially lead to an underestimation of the contact area and pressure, which would interfere with accurate calculation of wear rate or brake efficiency. Likewise, 3D metrology can assess the need for longer run-ins prior to the collection of tribology data to ensure flat-on-flat geometry and the removal of matter peaks (see Figure 3 top). In addition to this qualitative observation, metrology software can quickly and easily calculate high-level analyses, such as the Abbot-Firestone curve. This powerful bearing ratio analysis nicely emphasizes the difference between pre- and post-test topographies, and quantifies the drop of the highest protrusion points together with the increase of contact area.
Finally, the quantification of damage due to tearing and galling on used brake test pads is readily available through default advanced islands analysis (see figure 4). This method automatically acquires key information, such as number of pits, average and maximum depth, to rank severity of damages for different materials under test.
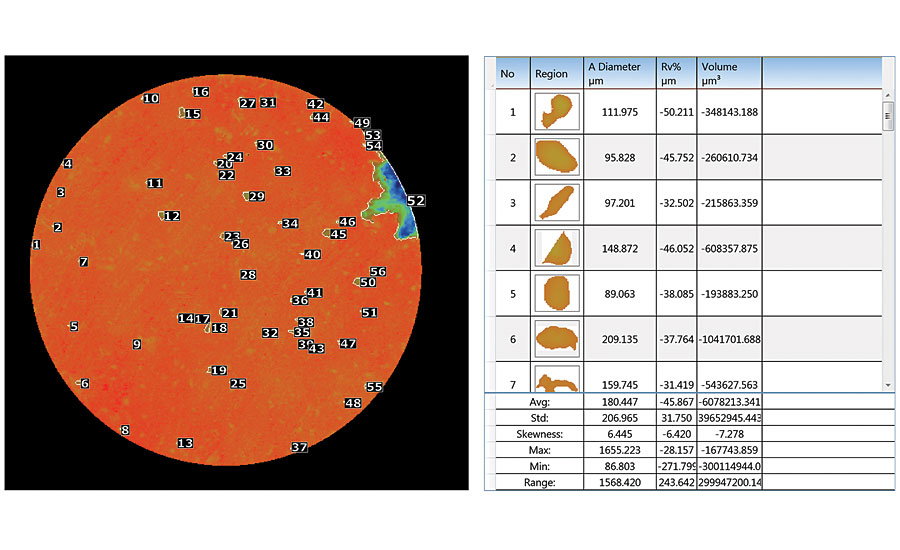
Figure 4. Automatic characterization of parameters, such as average diameter, area, deepest point (Rv%), and volume can be calculated for each pit, along with summary results for complete assessment of galling/tearing damages. Data are ranked from lowest to highest volume.
Conclusion
These are just a few of the many analyses that engineers and manufacturers can utilize for brake pad material applications, or other materials in high-friction applications. The metrology capability, simplicity, speed, and ease of use of focus variation optical profiling, combined with benchtop mechanical testing enables brake pad manufacturers to more completely research and test new formulations for brake pad materials, while reducing the extent of dynamometer testing required. Ultimately, the complementary nature of these technologies helps engineers improve pad quality at lower cost, while decreasing final time to market for brake manufacturing materials. Q
Looking for a reprint of this article?
From high-res PDFs to custom plaques, order your copy today!