Selecting Software for Data Collection & SPC
This software has come a long, long way since its first introduction in the early 1980s.

Data collection from bench tools, digital readouts or hand tools have similar requirements, but additional capabilities are required of the software.
In the manufacturing world there are many different types of data collection. Some types involve production counts or machine up time, but this discussion is centered on data collection for establishing and monitoring product quality. Collecting data related to quality typically involves dimensional measurements or other product properties such as form, hardness, strength or surface finish. Quality data is collected and reported to establish capability such as first article inspections and, in some cases, to create archive records of measurements or tests made at the time of manufacture. Additionally, and most frequently, quality data is collected to maintain process stability with improved capability over time using statistical process control (SPC).
SPC involves the sampling of critical characteristics on a regular basis and plotting the variations on X-Bar & R charts providing advanced warnings that components may deviate from specification. Control limits and trend warnings on these control charts can be very useful if observed diligently by the user. Originally, in the paper and pencil era, these warnings required careful attention by the person plotting the points but today, with the use of software to plot control charts and monitor for warnings, the person performing the checks can easily be notified and act.
Collecting the Data
Software designed to automate the process of creating control charts for SPC has been around for quite a few years and has matured in many ways but there are some critical capabilities that should be considered when selecting SPC software. Of course, the user interface should be simple and straightforward but in today’s digital world, in order to make the most of the automated digital test and measurement equipment, the software must be able to interface directly to a wide variety of CMMs, vision systems, digital readouts, wired hand gages and Bluetooth or wireless gages of all types with minimal setup needs. Providing direct connection to the digital test and measurement equipment not only speeds the process of data collection but it insures accuracy by eliminating keystroke errors. It is tempting for measuring machine OEMs to supply their own data collection and analysis software, but this results in too many different programs for the end user to learn and the data being saved in multiple locations.
Automated Measuring Equipment
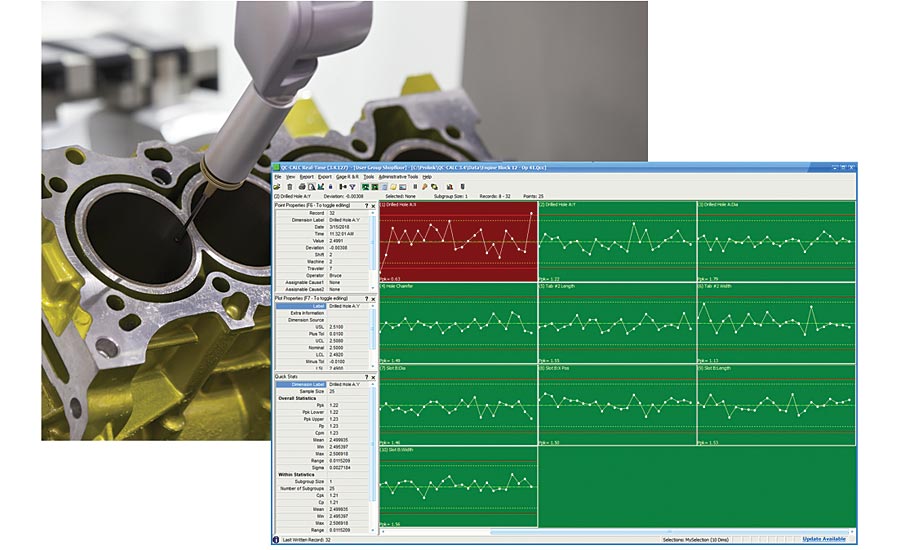
When collecting data from CMMs and other automated measuring systems the data collection software should collect data in the background with little or no intervention required of the operator. The software should provide real-time charting using on-screen color or other alarms to immediately notify the operator for prompt corrective action. Regarding corrective action, the software should also prompt the operator to enter the assignable cause of a violation and the corrective action taken. This information is invaluable in finding root causes of chronic component non-conformities. Another “must” capability for data collection software is to capture critical trace information such as operator, lot #, serial #, machine #, fixture station, etc. This makes it easy to extract information from the database for a particular lot, operator or machine, enabling engineers to identify equipment that needs maintenance or appropriate operator training.
Manual Data Collection
Data collection from bench tools, digital readouts or hand tools have similar requirements, but additional capabilities are required of the software. Unlike a CMM that has its own software and user interface, a digital caliper has nothing more than a digital display of the current value. The data collection software utilized for hand tools or manual keyboard entry must provide an interface to the operator and connection with the tool. This user interface should provide an easy method for entering trace fields with dropdowns, bar code or manual entry. If appropriate, the operator should be led through the process of measuring the part using written and graphical instructions. The measurements taken should be displayed immediately and be color coded to indicate good or bad. Safeguards to prevent the incorrect gage from being used on the current characteristic or unreasonable readings sent by an errant push on a footswitch are important.
Some data collection software products provide links directly to relevant documents on their network. This provides easy access and rapid display of a part print, inspection method sheet or even a video to guide them through the measurement process. Other useful features include quick selection of different measuring frequencies for setup versus production or to comply with different AQL levels for different characteristics. Another powerful feature includes performing math calculations on collected data making it easy to chart deviations from nominal instead of the actual reading or calculate relationships between characteristics. Data collected from hand tools should provide the same real-time charting and alarms as automated equipment.
Software designed to automate the process of creating control charts for SPC has been around for quite a few years and has matured in many ways but there are some critical capabilities that should be considered when selecting SPC software.
Reporting, Analysis & Visualization
There are many aspects involved in presenting useful information to the user. After you’ve collected the data, you must quickly turn it into useful information. This list of shows seven categories most companies will want to consider when selecting SPC software.
The data must be stored in a flexible database such as Microsoft’s SQL Server. The database schema and table structure should be published for integration into other company specific systems.
A selection of different reporting functions must be available. These include printing histograms, X-bar & R charts, capability analysis, simple statistical summary reports etc.
The software should be sensitive to non-normal data sets and make appropriate transformations as needed.
Filtering the data is critical. Being able to look at the data from a specific machine, time frame, or lot number is critical in establishing meaningful analysis within a process.
A variety of different visualization tools should be provided. Today’s digital highway has many more opportunities to make data available to key personnel in near real time such as dashboards and full shop floor views.
The more advanced software tools on the market include web services that makes real-time data available to employees regardless of their location on any device with a browser such as a tablet or mobile phone.
The use of QR codes in some plants allow managers to walk up to a machine, scan the code and instantly see the most recent capability performance of the machine. These visualization options can make a very big difference in the benefits derived from the data that is being collected as they can drive real process control and not just a post mortem.
Bonus features
Some companies in the medical field have special requirements for data collection and record retention. The medical field follows the 21 CFR Part 11 requirements for data collection and record keeping. Some of the more advanced data collection tools provide support for these documentation requirements. Features such as audit trails, user name and passwords, including digital signatures all make working within Part 11 procedures easier while meeting requirements. Validation of the software may also be required and if the software vendor can supply this, it is a plus. If needed in your company, these 21 CFR Part 11 capabilities are worth checking into.
Integration with other software is important when selecting data collection and SPC software. Frequently, customers require reporting in their own particular format using specific programs like Excel or Minitab. It can become a huge bottleneck to produce reports in a timely manner if the analysis software doesn’t have an easy integration with the required reporting tools.
Some companies are finding the benefits of collecting data from production machines to correlate the data to quality measurements. When reviewing the available data collection software, check to see if it can collect data from PLCs or on machine probing.
Conclusions
Data collection and SPC software has come a long, long way since its first introduction in the early 1980s. When purchasing this type of software, you should expect to get not only automated data collection from today’s digital test and measurement equipment but real-time charting, enterprise database storage, powerful reporting and visualization of the data and access to the data almost anywhere in near real-time. The paybacks can be significant if the features included are used. Q
Looking for a reprint of this article?
From high-res PDFs to custom plaques, order your copy today!


