Using “Just Noticeable Difference” to Automate Visual Inspection of Displays According to Human Visual Perception
Visual display testing is rapidly being automated using systems that are capable of objectively quantifying visual qualities like brightness, color, and contrast of displays.

Human vision is difficult to replicate.
Human perception is the ultimate standard for determining the visual quality of a device. However, the use of human inspection as a quality control method for development or production of devices is problematic because of the statistical variation between observers. Human vision is subjective, unquantifiable, and difficult to replicate. This variability may increase the risk of accepting defective devices or failing good devices—both of which add cost to the manufacturing process. Human inspection also lacks detailed quantitative information about defect types and occurrences, especially since human observers tend to only classify the most obvious defects. This has implications when evaluating devices that have a predominantly visual impact—like displays. What’s more, displays have become the pivotal user interface in consumer devices, from televisions to smartphones to automotive interiors, so quality control measures that take human visual experience into account are particularly important in display manufacturing.

Human vision is difficult to replicate.
Visual display testing is rapidly being automated using photometric and colorimetric imaging systems that are capable of objectively quantifying visual qualities like brightness, color, and contrast of displays. These systems are also used to detect defects like stuck-on or stuck-off pixels, lines, and mura (a term used for non-uniform areas or blobs in a display). Imaging systems with light and color measurement capabilities (imaging colorimeters) can give spatial tolerances (size, position, location) to visual qualities of a display. An imaging colorimeter preserves the spatial relationship of measurements across the display, which is required for measuring spatial variations.
Until recently, it has been difficult to devise clear software algorithms for automated defect classification directly correlated to human perception. This is in part because human perception of noticeable differences across a display is dependent on contextual factors that indicate defect severity, and standard display defect analysis algorithms innately are not.
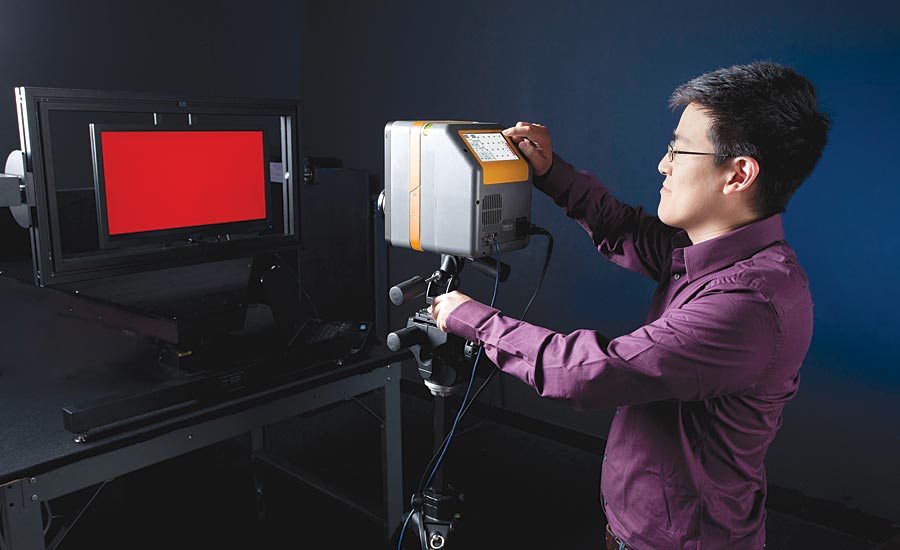
Lab-based display testing
Just Noticeable Differences
Recent advances in modeling human visual sensitivity to display defects have allowed the development of automated methods for detection of just noticeable differences (JND) for displays. Based on a sampling of human observers, the JND scale is defined so that a JND difference of 1 would be statistically “just noticeable” by an observer. On an absolute scale, a JND value of 0 represents no visible spatial contrast and an absolute JND value of 1 represents the first noticeable spatial contrast. By creating a JND map of an image of an illuminated display, mura defects can be graded according to severity with a direct correlation to human visual perception.
In Figures 1, 2, and 3, a colorimeter was used to capture a measurement image of an LCD display. Software applies the JND analysis for mura evaluation. In this case, a white screen is displayed on the LCD. Two JND maps are shown: a raw JND image, and a JND map with a color scale to distinguish between various levels.

Figure 1. LCD measurement with gradients near the edges of the display and two mura defects near the center of the display. The mura at the center are barely noticeable in the original image.
JND analyses are derived from a Spatial Standard Observer (SSO) software algorithm developed by NASA that incorporates a simple model of human visual sensitivity to spatial contrast.¹ The algorithm was specifically created for display metrology applications and the identification of display mura. This algorithm has been adapted for use in some image analysis software to identify and grade arbitrary display data captured by an imaging photometer or colorimeter.
A short synopsis of the SSO algorithm:
- The input to the algorithm is a pair of images: the test image and a reference image.
- The test image is the initial imaging colorimeter measurement, with potential mura defects.
- The reference image is computed from the test image using a low-pass filter designed to eliminate the mura.

Figure 2. The raw JND analysis of the display image clearly shows the mura at the center of the screen. Some artifacts (light leakage and dark spots) at the edge of the display are also visible. This analysis highlights mura that were barely visible in the original image.
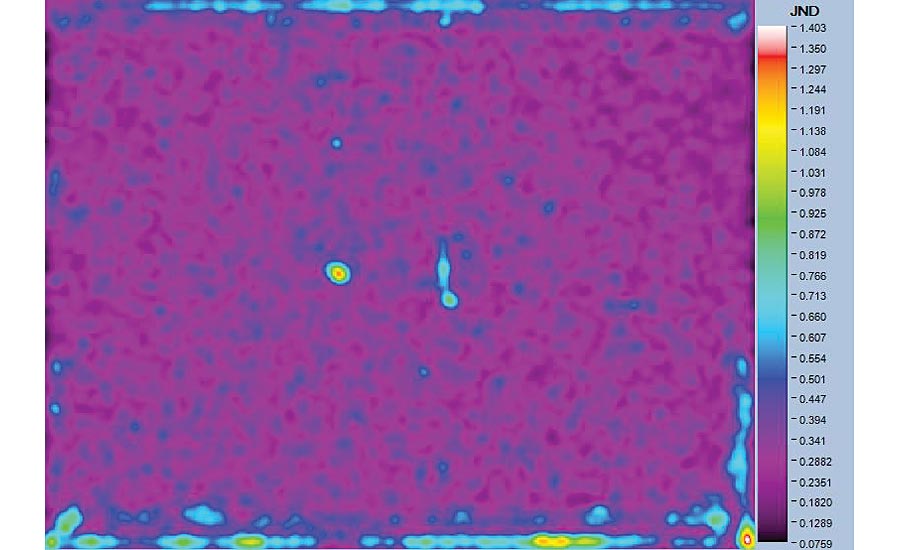
Figure 3. In this false-color representation of the JND map, it is clear that the two spots in the center of the display and some areas along the bottom of the display have JND values greater than 1 (the threshold value for being “just noticeable”). The speckled area across most of the display—apart from the mura at the center and along the edge—represents JND values of about 0.7 or lower and could be accepted or rejected based on pass/fail tolerance setting in the software.
The difference between test and reference images is filtered by a contrast sensitivity function (CSF). The CSF is a measure of the visibility of different spatial frequencies at different orientations. It models the decline in human visual sensitivity at higher spatial frequencies and at very low frequencies, as well as the lower sensitivity at oblique orientations (the oblique effect).
The filtered image is then multiplied by an aperture function. The aperture function models the decline in human visual sensitivity with distance from the point of fixation.
The final step is a non-linear pooling of the resulting image over space to produce the JND image.

Can you spot the mura in this image of a display? Would you and a colleague agree about its severity? Recent advances in modeling human visual sensitivity to display defects have allowed the development of a system for the automated detection of just noticeable differences (JND) that is consistent and quantifiable.
Implementation of JND Algorithms for Automated Display Testing
Display testing must generally take place in a darkened environment, using a dark room or enclosure to ensure accurate measurements. Dark curtains, black matte surfaces, and floor coverings that have a textured surface work best for dampening the reflected light. In addition, some mechanism for positioning the display at the appropriate working distance from the imaging colorimeter must be implemented. This can either be done manually or with a mechanical system.
Once an image of the display is captured, the JND analysis function processes the image to generate a JND map. The algorithm also outputs three JND metrics that may be used to grade the visual quality of the display. This has immediate value for production-line applications; for example, in both display fabrication facilities and final assembly lines. The generated metrics are:
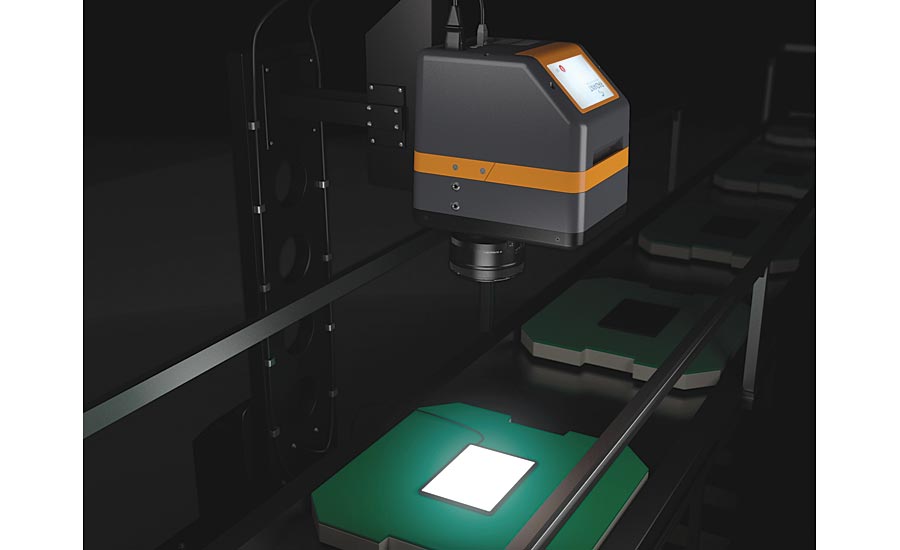
An imaging colorimeter is positioned above a display within a dark enclosure for in-line measurement.
(1) Aperture: The aperture function represents the fovea vision of the eye. The aperture JND metric at each display pixel reflects the visibility of artifacts in a region in the neighborhood of that pixel, when the observer is fixated on that pixel. The Aperture metric is best suited to small local artifacts, such as spot mura.
(2) Total JND: The result of a nonlinear pooling across the JND image. It gives an overall measure of the visibility of artifacts in the image. It is most useful when the image contains several artifacts at different locations in the image.
(3) Single JND: A metric that works best with large artifacts that extend over a broad region of the image. It is the result of a summation by the CSF raised to a certain power. The aperture function is not applied in this metric, so it does not assume the observer is fixated on a small area. It produces only a single value, rather than an image.
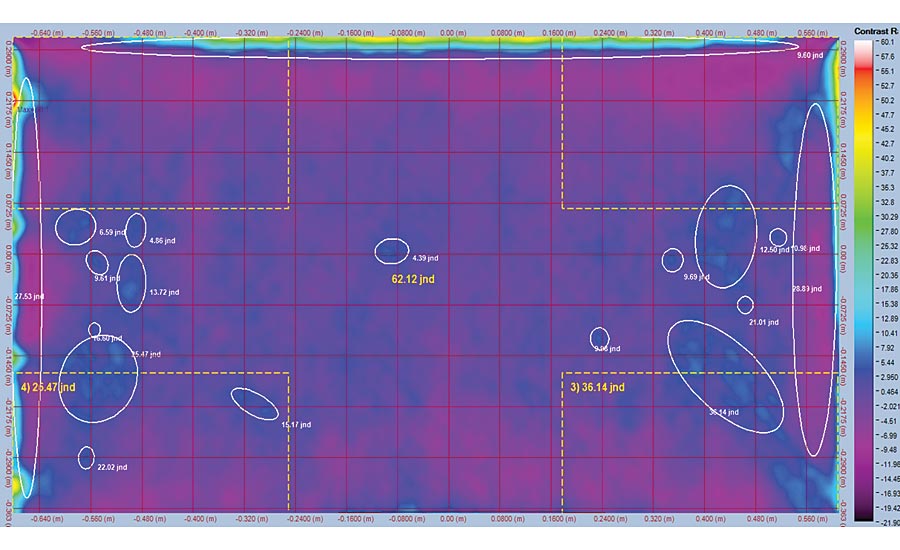
An example of mura in an image of a display, shown in TrueMURA Software using false color to represent contrast.
Measurement Examples
The JND analysis algorithm defined above has been applied to many display image samples to test its usefulness. The technique has been demonstrated to work well in identifying mura, and most importantly the computed JND value provides a numerical assessment that can be used to grade different mura or displays.
Conclusion
Display defect detection performed using a colorimetric imaging system and SSO-based JND algorithms demonstrates that JND analysis is an effective means of obtaining additional information about display image quality that extends beyond both human inspection and traditional automated analyses. This analysis system can be applied to any display type, including LCD, LED, mini- or microLED, and OLED, enabling consistent and quantifiable evaluation of any display device according to human visual perception and quality control based on the consumer experience. V&S
References
1. Watson, A.B., “The Standard Spatial Observer: A new tool for display metrology,” Information Display 23(1), (2007).
Looking for a reprint of this article?
From high-res PDFs to custom plaques, order your copy today!


