NDT | Standards
The Evolution of Ultrasonic Testing (UT) from Conventional UT to Total Focusing Method
As technology continues to advance, ultrasonic testing advances too.

Image source: Getty Images
Ultrasonic testing is one of the many nondestructive techniques used for the inspection of components. It is used in many industries including steel and aluminum construction, metallurgy, manufacturing, aerospace, automotive, and other transportation sectors. The technique provides many advantages including ease of use, speed, penetration, accuracy and sensitivity. Over the years, the technology has improved dramatically and continuously, now offering advanced imaging power with high resolution.
How It Works
Ultrasonic testing, or UT, is performed by sending an electric pulse to a transducer constituted of one or several piezoelectric crystals. The crystal(s) converts the electrical energy into mechanical vibrations sent into the component via a coupling medium. The acoustic wave interacts with all the discontinuities inside the component (defects, geometry, etc.) and returns to the transducer where the vibrations are converted back into an electric signal. Data can be then displayed in a number of different views such as A-scan, B-scan, C-scan, or T-scan with each providing a different way at looking at the inspection data.
Conventional UT
When ultrasonic testing started, ultrasonic instruments relied entirely on single-element transducers for which one piezoelectric crystal generates and receives ultrasounds. The technique was extended to dual element transducers that have two crystals, one emitting and the other receiving.
Depending on the type of inspections, measurements are typically performed with a normal incidence (thickness gage, corrosion mapping) or by using an angle beam (weld inspection). Normal incidence inspections can be done with the transducer directly in contact with the test piece or by using a delay line (immersion or L0 wedge) to help protect the front face of the transducer; this is especially useful when scanning the transducer along the surface of the component. Angle beam inspections are performed by modifying the angle of incidence of the transducer either in immersion or with a wedge. Operators can choose the angle of propagation inside the material using Snell’s law, which describes the relationship between the incident and refracted angles based on the ultrasonic velocity (either longitudinal or shear waves) inside the component and the wedge.
Since only one (or two) piezoelectric crystal is used, the sensitivity and resolution of the inspection depend greatly on the choice to the transducer characteristics. Sensitivity is the ability to detect small indications while resolution (axial and lateral) is the ability to discern two separate indications close to each other. Both depend on the shape of the beam, mainly the size, with respect to the size of the indications and the characteristics of the electric signal sent to the piezoelectric element.
Axial resolution can be improved by increasing the central frequency (smaller wavelength) and damping the transducer. However, higher frequencies are usually associated with higher attenuation inside the wedge and test piece, and excessive damping leads to losses in amplitude, both leading to lower sensitivity.
Lateral resolution is high when the width of the beam is narrow. Typically, the beam width is equal to the width of the transducer close to the transducer. Then, the beam converges to its narrowest width at a distance called the limit of the near field. Finally, the beam diverges in a zone called the far field. The near field distance and beam spread in the far field depend on the dimensions and central frequency of the transducer. Lateral resolution can be improved by using focused transducers, i.e., transducers with a piezoelectric crystal shaped either spherically or cylindrically. While lateral resolution is improved, the depth of field decreases.
Most often, operators have to make a compromise between sensitivity and resolution and choose transducers based on the expected detectability and sizing capability requested by standards.
Sometimes, several transducers have to be used for one inspection, such as weld examination, as sensitivity varies based on the nature of the defects. For example, a 60° vee weld would require the use of a SW60 transducer to look for defects, such as lack of fusion, along the chamfer same side as the transducer. A SW45 would be used to look for root and toe crack as 45° shear waves don’t lead to mode conversions when inspecting vertical defects. A SW70° could also be used to look for defects located on the opposite side of the transducer.
Despite its lack of flexibility, conventional UT is still the main ultrasonic technique used today as it offers a cost-effective solution for flaw detection and thickness measurement.
Phased Array Ultrasonic Testing (PAUT)
Phased-array technology started in the radio frequency domain by applying phase shift or delays to an array of antennas. This gave the ability to steer the electromagnetic energy without having to move the antenna. Phased-array transitioned to the ultrasonic world first in the medical world in the 1960’s and then to the NDT community in the 1980’s.
The principle of ultrasonic phased-array consists of firing the elements of the array in such a way that the wave fronts generated by each element interfere constructively or destructively in predictable ways that effectively steer and shape the sound beam. This process, called delay law calculation, is done by applying a time delay to each of the elements of the array both at transmission and reception. There are three major types of delay laws.
- Electronic scanning: A group of elements or aperture is multiplexed across the entire array at a constant angle. This is equivalent to moving a conventional ultrasonic transducer without having to move the probe. This is the preferred focal law for corrosion mapping as it drastically improves productivity.
- Focusing: The elements on the outside are fired first, and then progressively until the one in the center is the last to be fired. It would be the same as using a focused conventional UT except that the depth of focus can be changed dynamically by changing the time delays.
- Beam steering or sectorial scanning: The beam is steered through a sweep range of angles using the same group of elements. This would be the same as using a conventional UT and changing the wedge to generate different angles except flexibility is vastly improved (any angle can be generated without a different wedge each time). This is the preferred focal law for weld inspection.
Beam field calculations for these three delay laws are presented in the following figures. It is possible to combine them to generate even more complex acoustic beams.
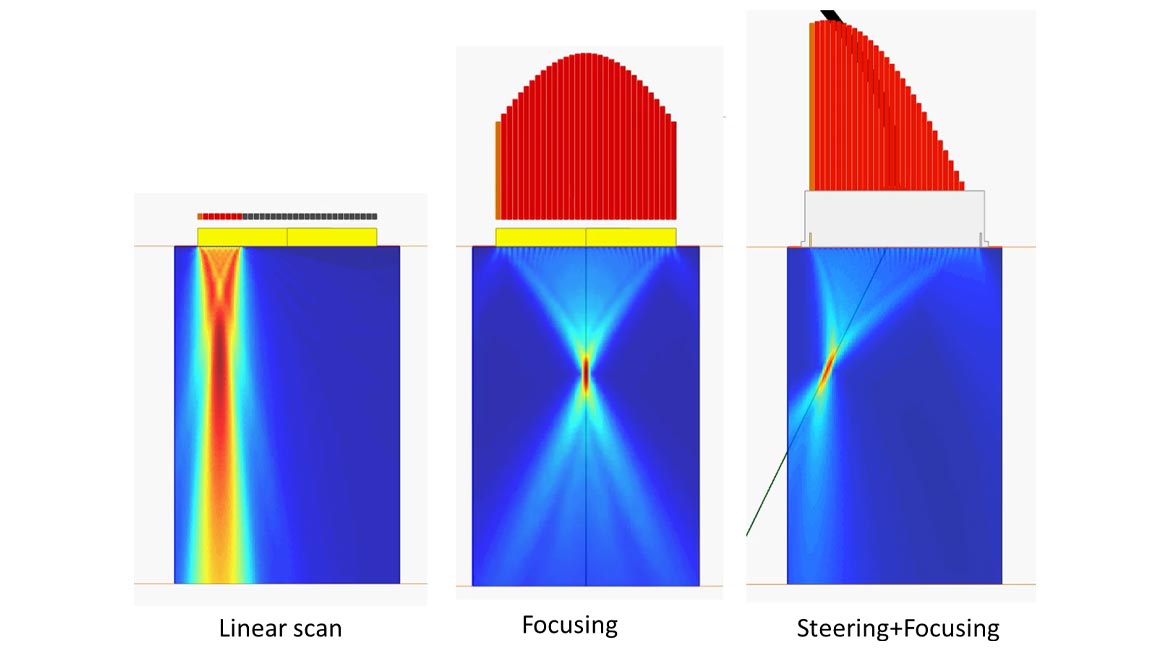
Image source: Eddyfi Technologies
When dealing with PAUT inspection, an important aspect is the design of the probe. As mentioned before, a PAUT probe is composed of several elements that can be arranged in various ways. The most common PAUT probes are linear (1D), matrix (2D), annular (1D), and sectorial (2D). 1D PAUT probes can only manipulate the acoustic beam in one plane while 2D arrays can steer the acoustic energy in the full volume of the component.
When designing the probe, it is important to keep a few rules in mind.
- A PAUT probe cannot focus past the limit of the near field of the entire array. It is thus recommended to use large elements and/or a large number of elements for users who are looking to generate a small beam width deep into the component. Of course, a larger element count leads to additional costs both for the probe and PAUT electronics to control it.
- Large elements tend to generate grating lobes. Grating lobes are basically acoustic energy sent in undesired directions. This energy can interact with the geometry and other defects and lead to additional parasite echoes that can make the interpretation quite complicated and sometimes hide indications.
- There is a maximum limit for the refracted angle that is possible to generate; a probe cannot steer the energy at 90°.
The design of a PAUT probe is thus a compromise between cost, the electronic system limitations in terms of many elements it can control, the desired sensitivity and resolution.
Several industries have benefited from the many advantages offered by PAUT technology over conventional UT.
- The improved scanning speed allows users to scan large assets looking for corrosion or scan welds at a much faster rate.
- The entire weld volume, root, fusion boundaries, and heat affected zones (HAZ) can be scanned with only one probe offering great flexibility.
- Having an image rather than an A-scan signal has tremendously helped the interpretation of data improving Probability of Detection (PoD) and minimizing false calls.
PAUT has been greatly accepted as the replacement for radiographic inspections. The modern, simple and portable PAUT equipment has further accelerated the acceptance of PAUT inspections.
Full Matrix Capture (FMC) /Total Focusing Method (TFM)
The total focusing method technique can provide greater clarity and precision compared to PAUT testing. It is an inspection technique that uses standard PAUT probes but rather than performing typical delay laws (linear, focusing, or sectorial scanning), it focuses the acoustic energy at every pixel of a region of interest (ROI). This provides optimal spatial resolution within that region which can help technicians identify small defects in challenging inspections.
The technique is composed of two steps: the data acquisition part called full matrix capture, and the reconstruction called total focusing method. FMC/TFM was typically done in post-processing but recent developments in ultrasonic equipment have allowed real-time inspections at scanning speeds close to PAUT.
Usually, when referring to FMC, one refers to the elementary FMC for which all the pairs of transmitters/receivers in the array are separately digitized and saved. This means that potential indications are seen from all the possible angles as the FMC data set contains all the acoustic information between each element of the probe and that indication.
The TFM algorithm consists of coherently summing amplitudes from the FMC dataset at every pixel of the ROI. When a defect is present, each signal of the FMC contains a little bit of information for that defect. By summing the various contributions, the TFM image will display pixels of high amplitude. Conversely, for areas of the ROI with no defect, summing the various contributions leads to summing noise and thus to pixels with exceptionally low amplitude.
The main advantages of TFM over PAUT are:
- Optimal focusing and spatial resolution everywhere
- Direct imaging of a large area for one probe position
- All angles reachable with the array simultaneously
- Defect characterization
- Comprehensive imaging of defect
- 3D imaging
Usually, the disadvantages can be:
- Data file size: Data depends on the number of pixels; each frame can be larger than an E-scan or S-scan. If the FMC dataset is recorded, then the data file is an order of larger magnitude.
- Productivity: Scanning speed depends on the number of elements, number of pixels. Speed is usually 2 to 3 times slower than PAUT, but it can be improved using other transmission modes.
- Sensitivity: Firing one element at a time sends little energy, which can be problematic for thick and attenuative material. It can be improved using other transmission modes.
To overcome these disadvantages, other FMC acquisition schemes are possible such as Plane Wave Imaging (PWI). PWI consists of generating a sectorial scan using all the elements of the array for transmission while reception consists of listening with all the elements individually. The advantages over elementary FMC are:
- Productivity as the process requires less emissions and has less data to process
- More energy as all the elements of the array are fired simultaneously rather than only one by one
Adoption of the technique has been made easier with the publication of the revised ASME V and ISO 23864 and 23865 standards. Technique description, equipment standards, personnel qualification, and application standards are described in detail allowing operators to prepare their procedures with care.
The following images show an example of TFM inspections. The top one shows the detection of High Temperature Hydrogen Attack (HTHA) while the bottom is a weld inspection using a multigroup configuration with one TFM on each side of the weld.
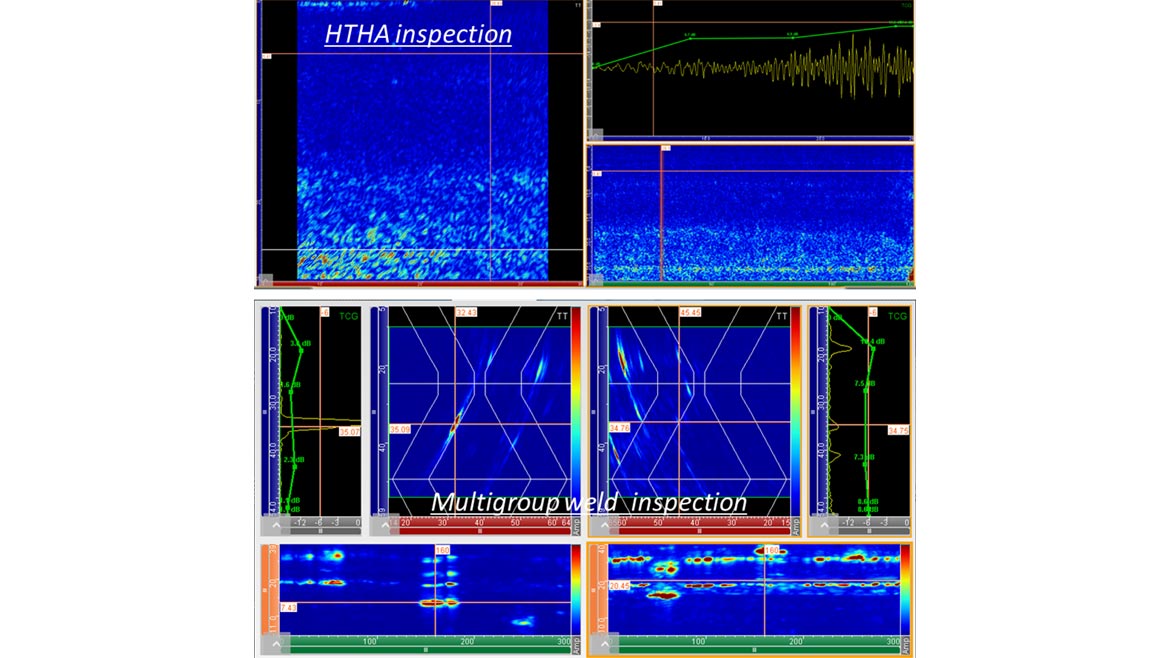
TFM Inspection Examples | Image source: Eddyfi Technologies
During a TFM inspection, the NDT technician can choose to look at the data using different modes of reconstruction. The modes are different types of possible ultrasound sound paths to go from the elements of the array to the various pixels of the TFM image. ASME lists direct modes (L-L, T-T…), corner modes (L-LL, L-TT…) and indirect modes (LL-LL, TT-TT…), where “L” stands for longitudinal wave, “T” for transverse, and the “-” indicates a reflection off one of the test piece surfaces.
Corner and indirect modes tend to favor specular reflection leading to higher amplitude signals. Essentially, the right positioning of the probe leads to an acoustic path quasi-normal to the planar defects. By combining various modes, TFM offers improved sensitivity and imaging capabilities not seen before.
Ultrasonic testing has evolved dramatically over the years going from one A-scan signal for the technician to interpret to full high-resolution 3D images superimposed to the geometry of the component. Rapid developments in instrumentation have provided technicians with smaller and more rugged instruments with greater capabilities. The goal is to provide an increase not only in detection but also in characterizing and sizing defects with high reliability and as quickly as possible to minimize downtime. As technology continues to advance, ultrasonic testing advances too.
Looking for a reprint of this article?
From high-res PDFs to custom plaques, order your copy today!


