Test & Inspection
An Introduction to Dynamic Micro-indentation Measurements
This article will highlight the broad applicability of the dynamic hardness technique.
All Images Source: Shimadzu
In common micro-indention measurements (ASTM E368), a diamond probe of specific shape (Knoop or Vickers) is pressed into the sample specimen using a controlled force (9.8 x 10⁻³to 9.8N.) Once the pre-set test force is applied, the probe is typically held for 10 to 15 seconds and retracted. The dimensions of the resulting indent are then measured using an optical microscope. The Vickers or Knoop hardness of the material is calculated from the applied force and the dimensions of the indent that persists in the material after the probe is retracted. The Vickers hardness number (VH) is calculated from the force applied divided by the surface area of the permanent impression made by the indenter. The Knoop harness number is obtained by diving the applied force by the projected area of the permanent impression made by the indenter. 1
This powerful technique is an important characterization tool used in many industries to quantify surface hardness variations due to a wide range of processes such as flame hardening, shot hardening, carburization and nitriding. However, many types of materials are not amendable to analysis using ASTM E384. For example:
- Elastic materials such as rubbers may “bounce back” when the indenter is withdrawn and not retain a permanent measurable impression of the indenter.
- Characterization of very thin films may require force loads well below the standard to reduce the contributions of the substrate material.
- Brittle materials such as ceramics or glasses may crack if the indention force is too large.
- Measuring the indents may be difficult for optically transparent materials.
For these types of samples, dynamic micro-indentation measurements may be useful.
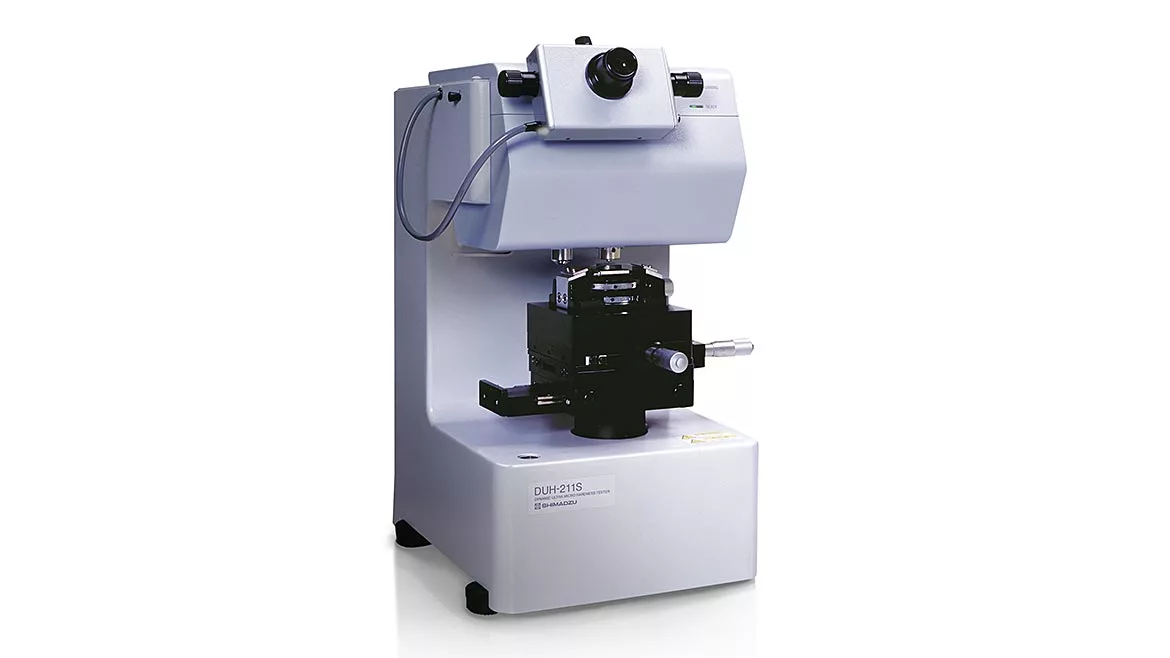
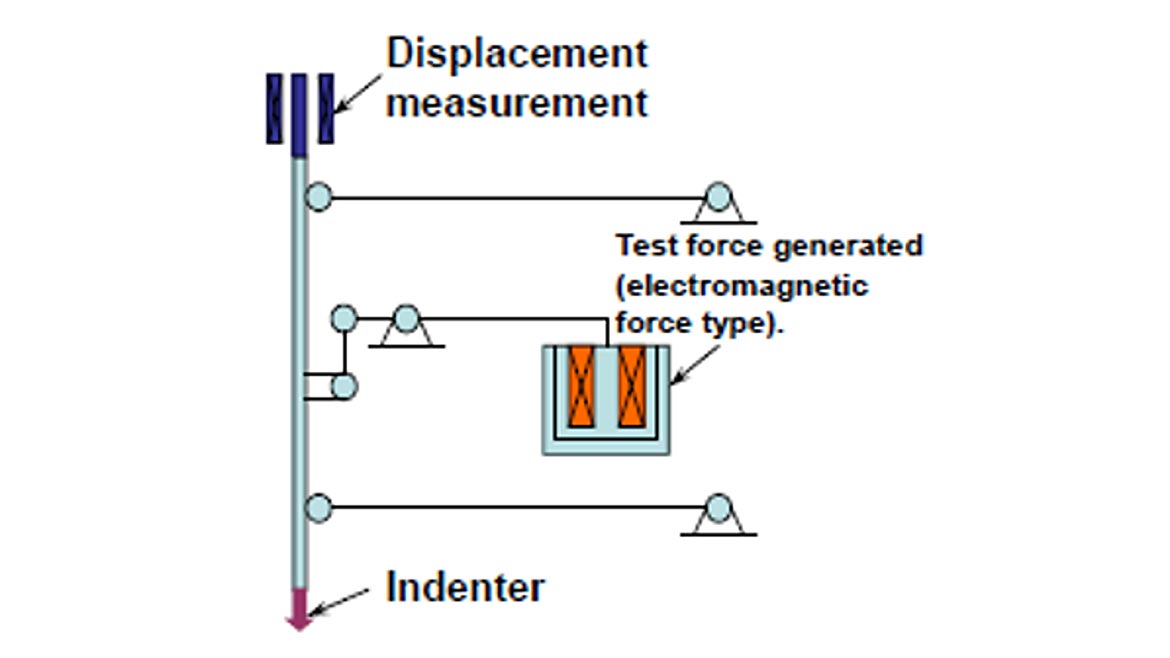
Figures 1 and 2 show a commercially available dynamic micro-indentation measurement device, and basic schematic. With dynamic micro-indentation measurements, a probe is pressed into the sample using an electromagnetically controlled force while the penetration depth is monitored in real time using a differential transformer. With this design the force range is 0.1 to 1.981 mN which is much lower than the force range of conventional micro-indention testers. The probe displacement range is 0 to 10 microns, and the minimum measurement increment is 0.0001 micron. The low-test forces and precise displacement measurement allow small samples and thin films to be analyzed accurately. A 115-degree pyramidal (Berkovich) indenter is commonly used but Vickers and Knoop probes are also available. The system design permits several loading test modes such as load-hold, load-unload, step loading and cyclic testing.

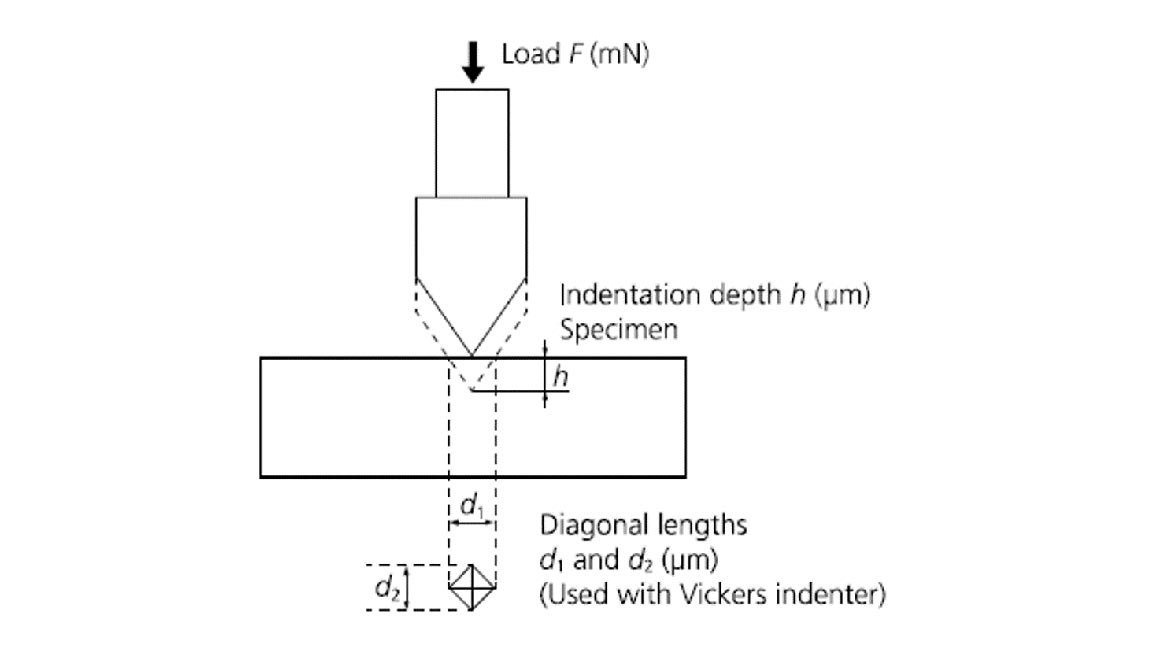
The observed penetration is related to both the plastic and elastic deformation of the specimen. The relationship between test force and indentation depth can be used to evaluate several parameters such as Marten hardness, Indentation hardness, and Indentation modulus. ISO 14577-1 (Annex A) describes these calculations.2 Figure 3 shows the parameters used in the calculations. For example:
Martens Hardness HM115 = 1000 F/26.43 x h2 (N/mm2)
EXAMPLES
Example 1: Super Fine Wires3:
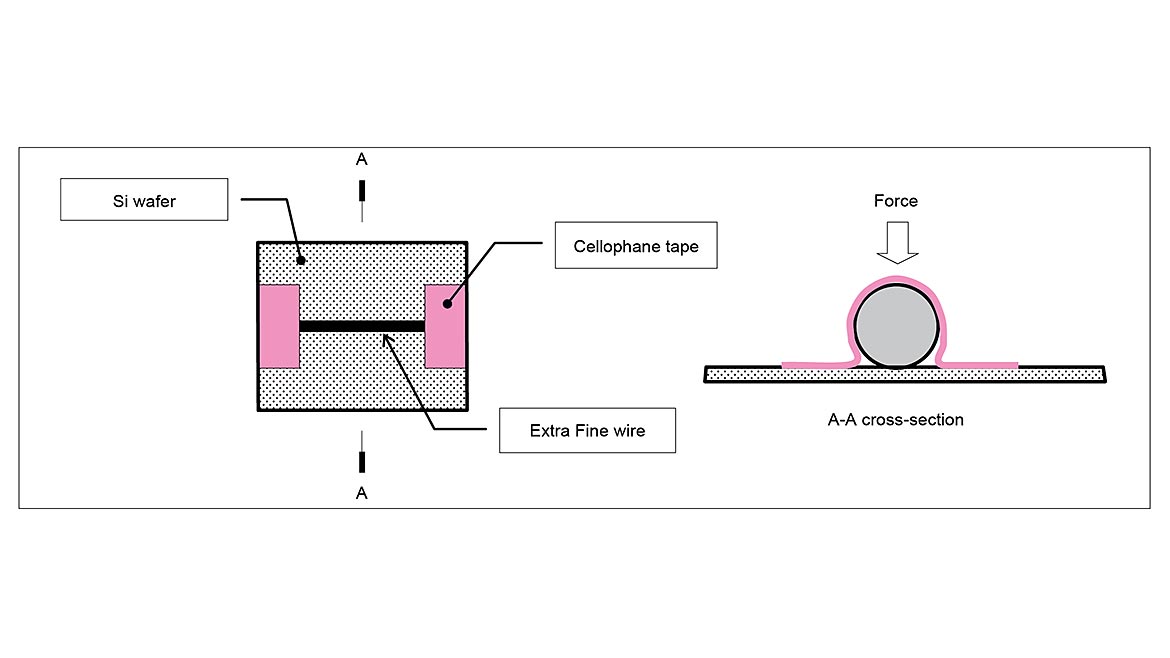
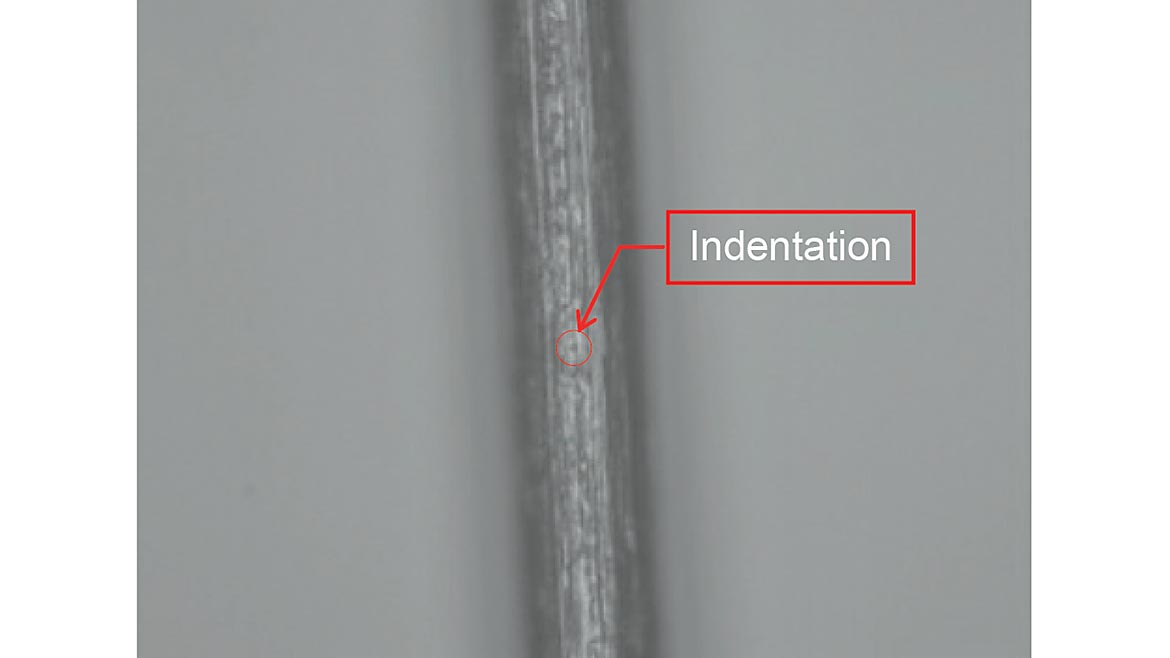
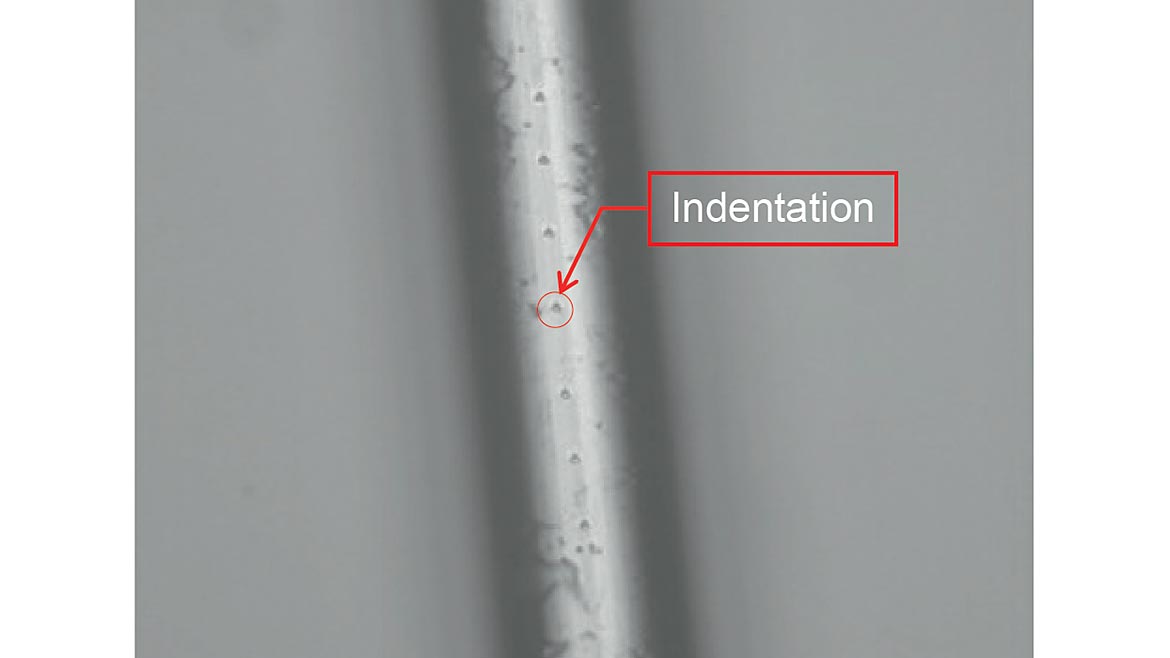
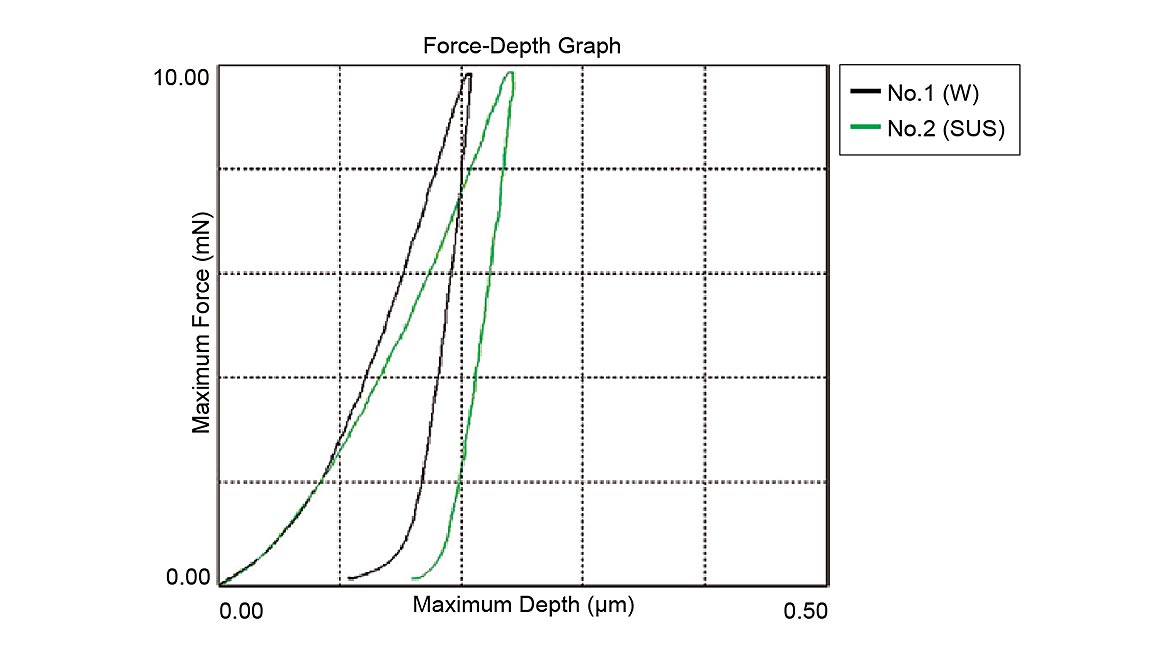
Fine tungsten (20-micron diameter) and stainless steel (30-micron diameter) wires were tested without the necessity of mounting in resin. The samples were simply taped to a silicon substrate as shown in figure 4. Figures 5 and 6 show the indentations on the tungsten and steel wires respectively. Figure 7 shows the force indentation depth curve for the two materials.
Example 2: Thin Diamond-Like Carbon Coating (DLC)4
Thin DLC coatings are used to improve wear resistance and lubricity in a wide variety of industrial applications. This example shows a load/unload test of a 1-micron DLC coating. Note that the shallow penetration depth allows the thin DLC coating to be evaluated without influence from the substrate.
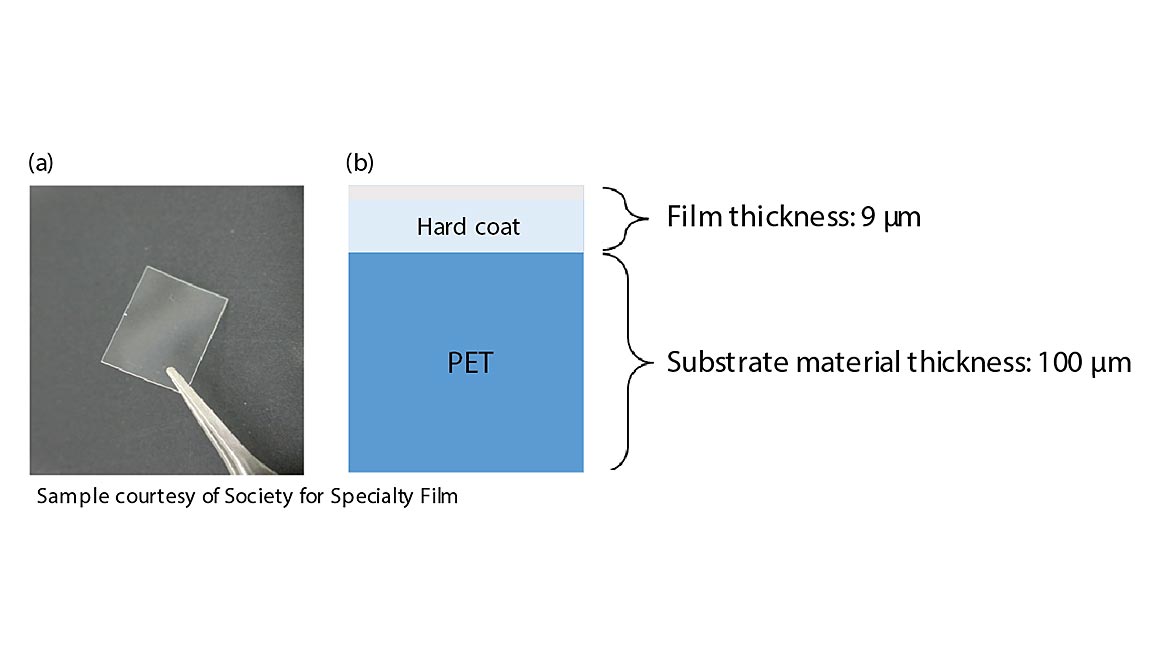
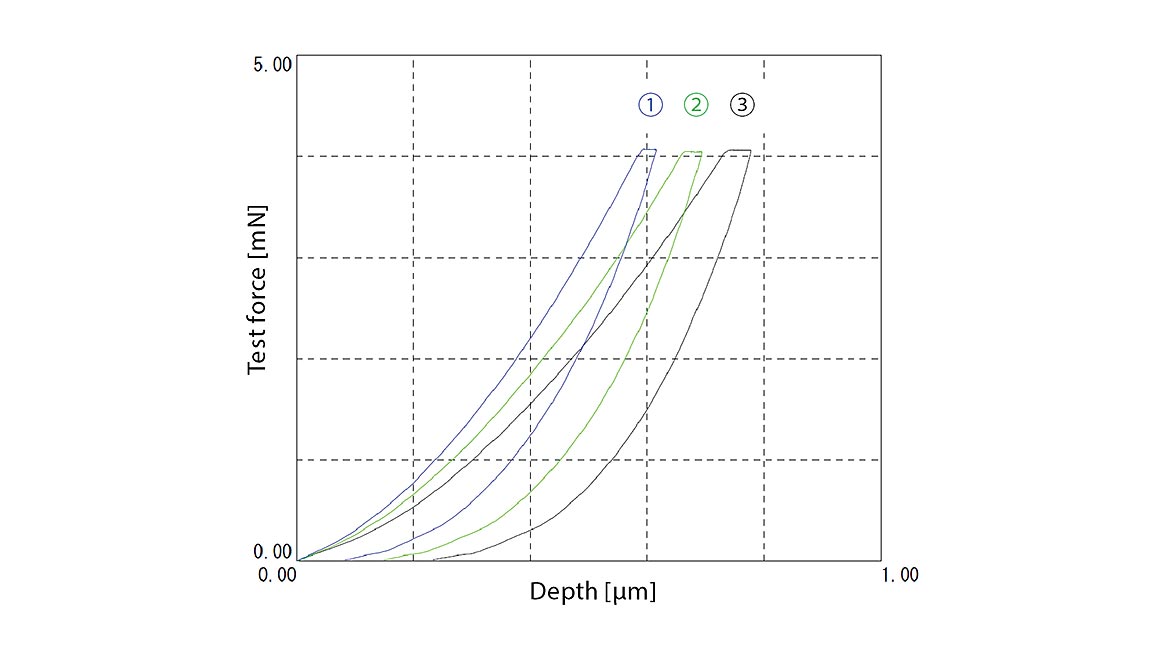
Example 3: Functional Films5
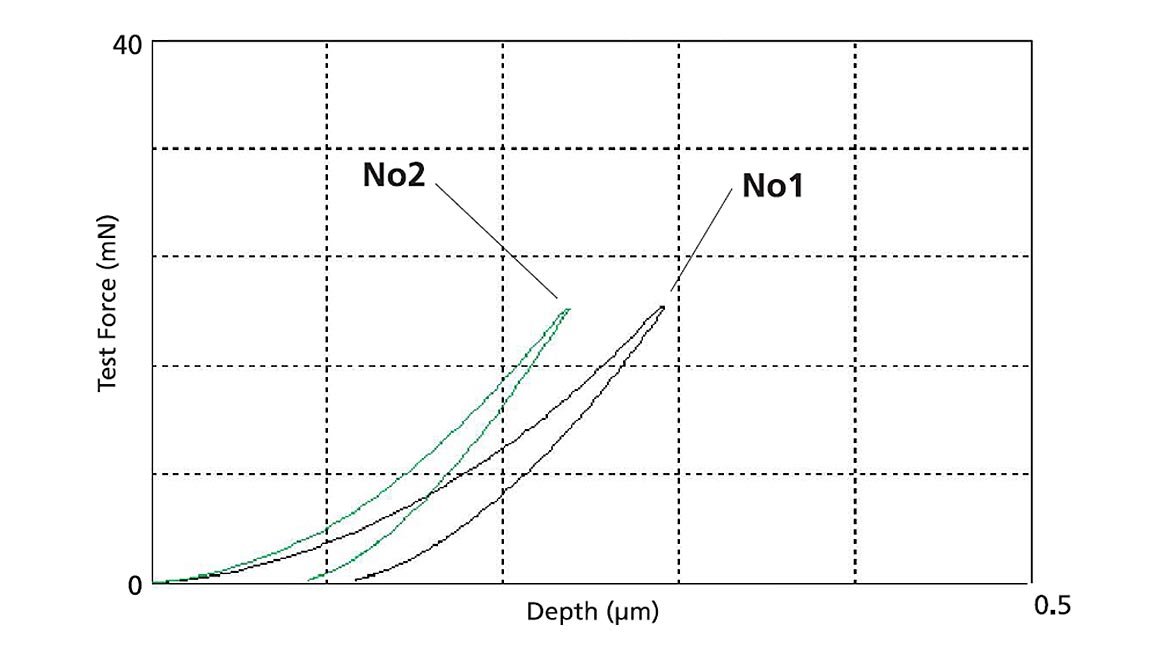
In this example three different 9-micron thick hard coatings were deposited on PET substrates and tested in accordance with ISO 1477-1. Figure 10 shows the force indentation depth curves for the three coating types.
Plastic Testing: ISO/TS 19278-20196
The application of the micro-indentation technique to the analysis of plastics has been codified by International Organization for Standards in 2019: ISO/TS 19278-2019. Table 1 shows the primary test conditions defined in ISO/TS 19278-2019
Example 4: Thins Plastic Samples7
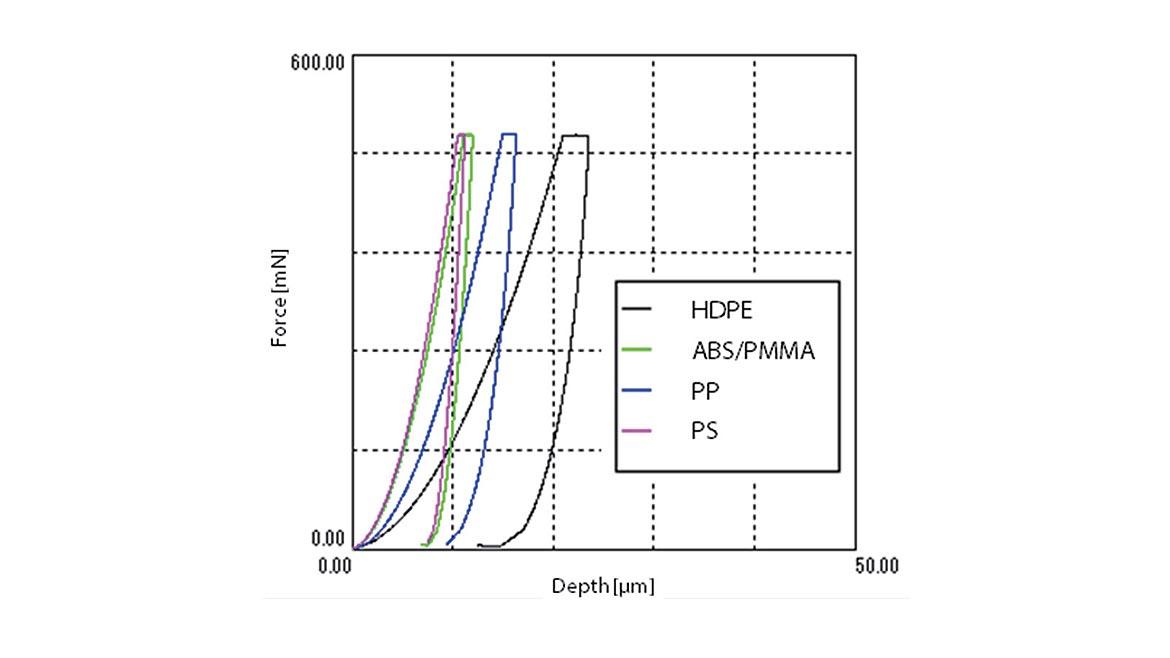
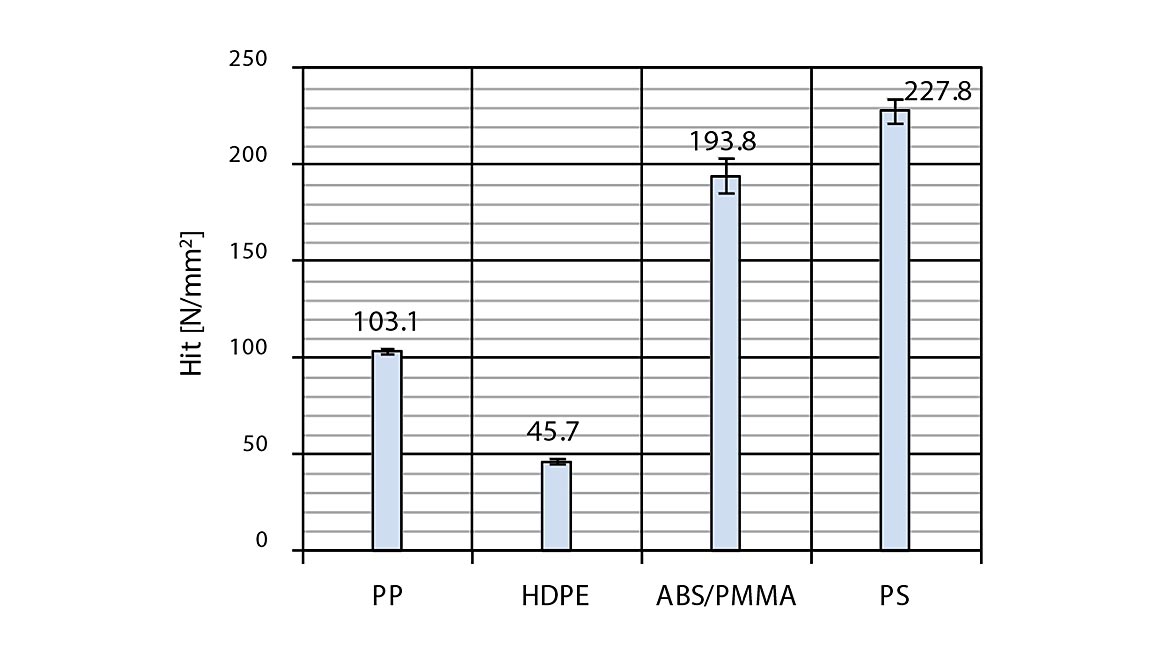
Thin rectangular blocks (20mm x 10mm x 3 mm) of four plastics: polypropylene, high density polyethylene, acrylonitrile butadiene styrene/polymethyl methacrylate and polystyrene were tested in accordance with ISO/TS 14277-2019.
Figure 11 shows the force indentation depth curves. Table 2 and figure 12 show the average values of the calculated indentation hardness.
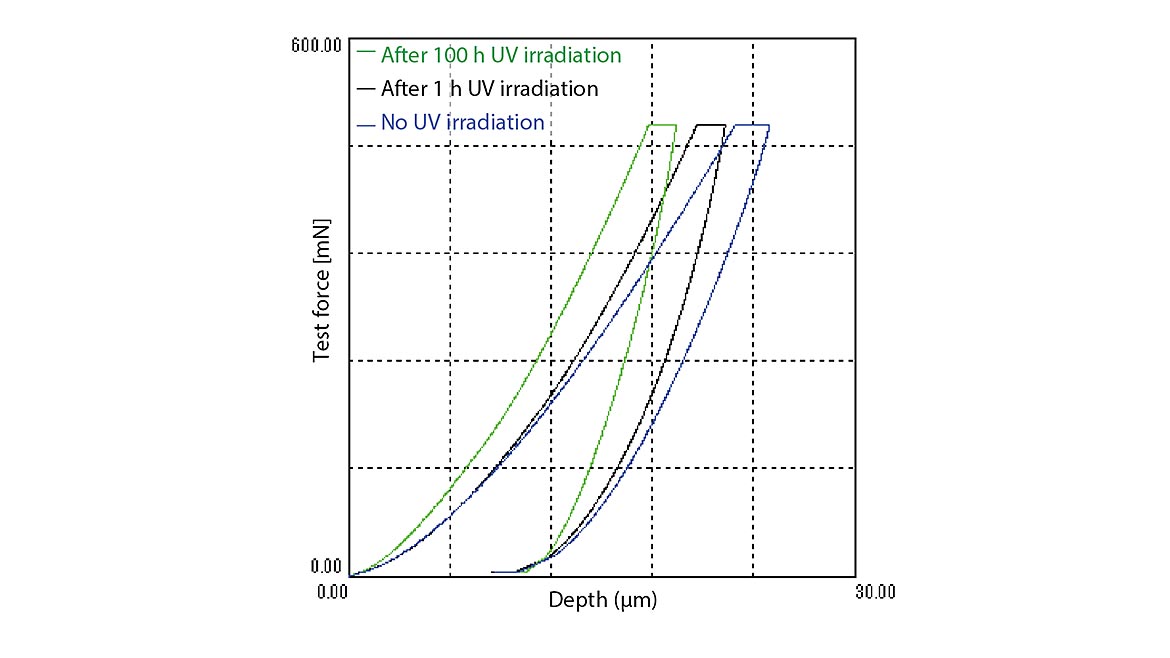
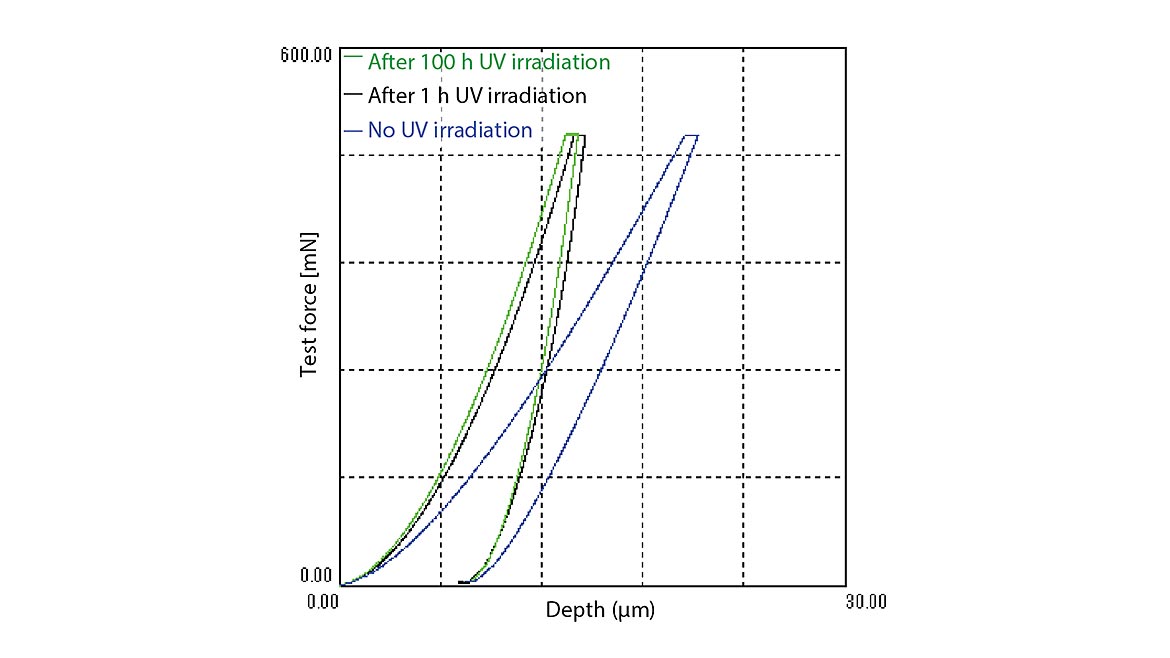
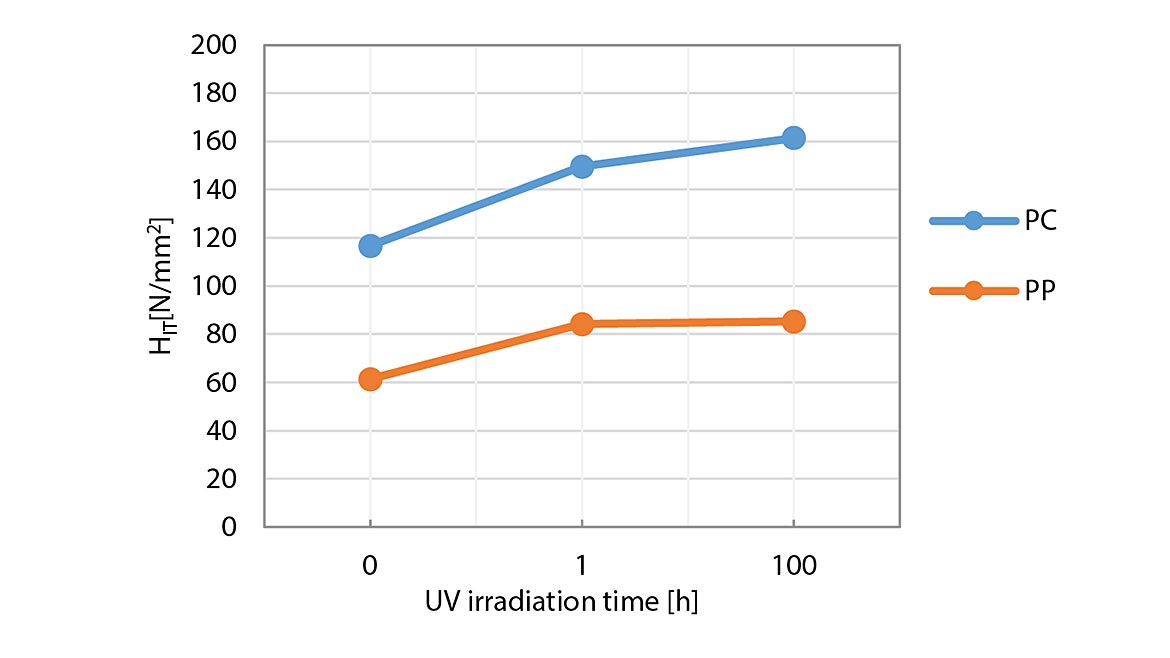
Example 5: UV Weathering Of Plastics8
This example shows the hardening effects of UV exposure on two plastics: polypropylene and poly carbonate as measured in accordance with ISO 19278-2019. Figures 13 and 14 show the force indentation depth curves for PP and PC exposed to 0, 1 and 100 hours of exposure to UV. Figure 15 shows the increase in indentation hardness with UV irradiation time.
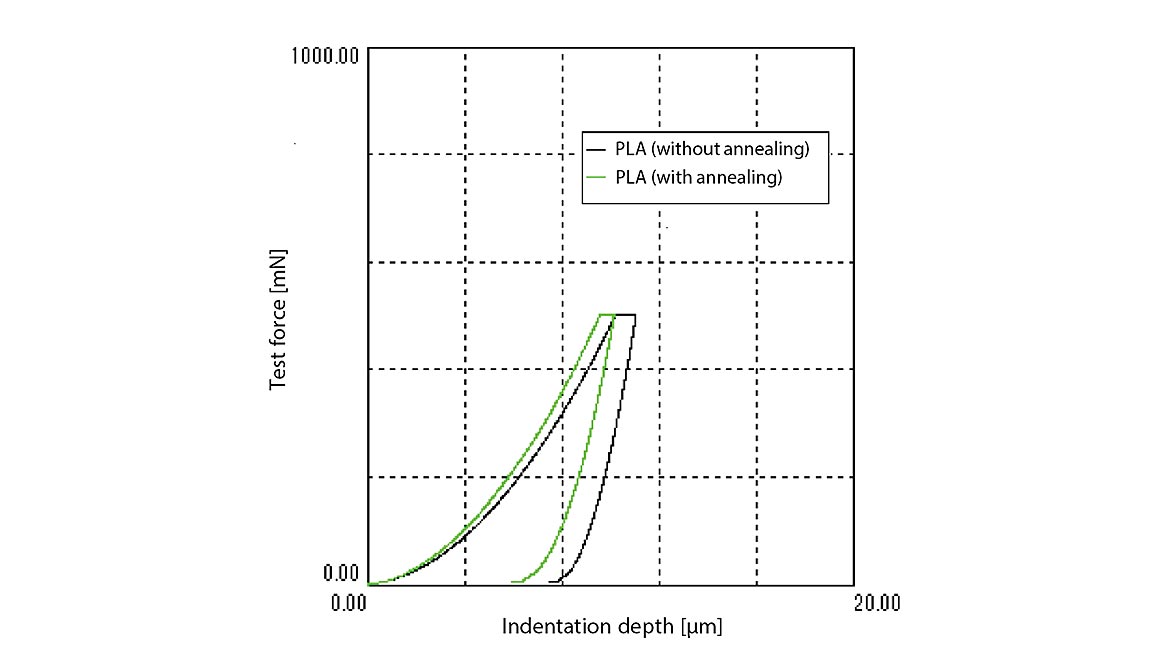
Example 6: Effects Of Heat Treatment On Polylactic Acid Resin9
This example shows the hardening effect of annealing on a plant derived plastic, polylactic acid resin. Indention hardness measurements were taken in accordance with ISO 19278-2019 on PLA samples before and after a 30 minute anneal at 1000C. Figure 16 shows the force- indentation depth curves.
Conclusion
These examples highlight the broad applicability of the dynamic hardness technique.
For additional details please consult the reference sources listed below.
Looking for a reprint of this article?
From high-res PDFs to custom plaques, order your copy today!


