The Power of PCRT
In some operations quality and nondestructive testing (NDT) are so closely related they are considered to be almost synonymous. Other operations work on the principle that “you can’t inspect quality into a product” and testing and inspection are avoided because they are not productive.
What most agree on, though, is that acceptable product performance is the ultimate goal of any manufacturer. This requires not only well-controlled material input and process control for making acceptable products, but also a way to ensure that, when products are used where failure could be dangerous or expensive, a screening method ensures the rejection of unacceptable products. Performance-based screening using NDT is an approach to guarantee that high-performance, quality parts are shipped to the customer.
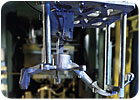
A Magnaflux Quasar process compensated resonant test station ensures the structural quality of a ductile iron steering knuckle. Source: Mark Anderman, The WILD Studio; courtesy of ACP Manufacturing
How To Make This Happen
To date, almost all quality inspection processes rely on indications of anomalies to locate possible deviation from normal production and do not directly relate to structural performance. Inspection is subjective rather than quantitative. However, monitoring the variation in structural characteristics produces an indication of process and metallurgical variation that influence the structure of the part. These quantitative data are available and correlate with the performance of the parts. The data also provide an indicator of whether unacceptable process variation is occurring.To apply the general concept, let’s look at one established technology that is gaining acceptance in operations such as automotive parts production. The practical application of this specific method is limited to discrete metal or ceramic parts-as opposed to assemblies-but the general concept of measuring, analyzing and using some objective attributes of a representative sample set of parts makes the concept flexible.
The technology-process compensated resonant testing (PCRT)-is based on the analysis of the resonant vibration pattern of each part produced in series production. The PCRT system requires a means of measuring, recording and analyzing the resonant vibration frequencies in a part with sufficient accuracy and precision to reflect the structurally significant characteristics of that part. But other methods that use objective, quantitative information could be substituted to accomplish the same goal as long as they account for acceptable process variations.
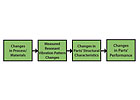
This figure illustrates the PCRT performance-based concept. Source: Magnaflux Quasar Systems
How the System Gets Information
PCRT requires a sample set consisting of enough parts to allow an analysis of the structural similarities and differences among parts. Each part in the sample set must be objectively classified as acceptable or unacceptable. The selection of the sample set is fundamental to the success of the system. It must represent the full range of acceptable process variations and include those rare process variations that can lead to unacceptable structural performance.If practical, the parts are destructively tested to measure their structural acceptability or, when that is not practical, the persons responsible for the design and production of the part must classify the parts on an objective, functional basis. But, to count on conventional NDT methods to determine structural acceptability of parts is generally not appropriate because methods such as X-ray and ultrasound are not empirically correlated with structural performance.
To illustrate this, the OEM test figures show test results performed on a set of cast aluminum parts. Parts accepted and rejected by both X-ray and ultrasound were structurally tested. The results show that structural failure level does not correlate well with NDT indications. These, and similar indication tests, are not suitable for producing an appropriate sample set.
The PCRT method of analyzing the similarities and differences in the frequency patterns for each part provides a basis for measuring the same few resonances on each part to be used in an algorithm to discriminate between those parts. The power of this method is twofold:
- It provides a numerical, quantitative and non-subjective score that is directly related to the parts compliance with structural requirements for performance and reliability, thus linking the results of process variation with potential performance variation. This also provides the extremely important capability to detect and to remove from distribution any parts that are deemed structurally unacceptable based on a performance related measurement.
- The part’s score is based on its conformity with other process compliant parts.
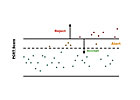 The figure shows the basic concept associated with PCRT. The vertical scale represents the PCRT score for each part, which is used to accept or reject parts based on the training set results. The top solid line is the accept/reject cutoff point that is set during the training process and based on the parts performance. Source: Magnaflux Quasar Systems
How This Works in Practice
As noted, start out with a sample set or training set. In this example for PCRT, resonant frequency data are taken on each of the parts, which are then tested to destruction and then formally categorized according to the structural testing results.
The parts’ resonance patterns are then analyzed based on the categorization derived from structural testing. This analysis leads to a quantitative score basis for creating a test evaluating the structural acceptability of production parts. When the training set is truly reflective of the acceptable process variations, then the score of each production part that is tested will generally be reflective of how close that part is to the process limits allowable for structural acceptability.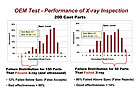 These figures show test results performed on a set of cast aluminum parts. Parts accepted and rejected by both X-ray and ultrasound were structurally tested. The results show that structural failure level does not correlate well with NDT indications Source: Magnaflux Quasar Systems
An Example
The figure above shows the basic concept associated with PCRT. The vertical scale represents the PCRT score for each part. That score is used to accept or reject parts based on the training set results.
The top solid line is the accept/reject cutoff point that is set during the training process and based on the parts’ performance. That is, any part that scores above that line is rejected. Remember, this cutoff is ideally determined by the pattern score for those parts that structurally failed below a specific design level during testing. Any parts below that line are acceptable parts.
Note, however, the dashed line. The area above the dashed line and below the reject line represents parts that may have some structural characteristics similar to either acceptable or unacceptable parts. Where this line is set depends on the specifics of the part being tested, the process variability and other aspects unique to the given situation. However, a dashed line can always be drawn such that when too many parts score above the line, but below the reject line, the engineer in charge should revisit the process for possible root cause. It is up to the engineer to determine if the process is changing in a benign or unacceptable manner.
An advantage of PCRT is that if the change is benign, the pattern recognition can be retrained to accept for it. If it is not acceptable, then the process needs to be adjusted.
The allure of being able to quantitatively score and accept or reject parts specifically tied to performance-based testing offers significant advantage to parts’ manufacturers and their customers. The quantitative-based parts classification derives from solid, performance-based data, not human judgment. Additionally, when the quantitative values that are measured are tracked, valuable information can be made available to help avoid, or immediately detect, unacceptable process variation. The unacceptable process problems are found because they create unacceptable structural variation. For the case of PCRT, the variation is directly traceable to accept/reject structural criteria. NDT
Looking for a reprint of this article?
From high-res PDFs to custom plaques, order your copy today!


