Take a Closer Look at Laser Scanning

Laser scanning technology has emerged as an increasingly popular solution for many measurement applications. The ins and outs of laser scanning are not as well understood as other mature metrology technologies. Some frequently asked questions about the technology and commonly misunderstood concepts are clarified.
Q: Why would I want to laser scan an object in the first place? And what applications are right for scanning?
A: There are may advantages to laser scanning and reasons that it might be used, but each application should be examined to determine if scanning makes sense. A major benefit is that scanning captures the entire surface of the part. For example, in the tactile inspection world, multiple single points are used to extract features such as holes, slots and planes. Scanning the same area provides much more data, a point cloud, which is then used to make the same dimensional calculations. In high curvature areas or free flowing part design, measuring with a tactile (touch) probe will yield relatively few points of high quality. Analog scanning probes will deliver more points than tactile with a speed trade-off.
Laser scanning generates thousands of points in a short period of time and delivers a better representation of the contour shape with overall accuracy being the trade off. It is extremely important to evaluate the requirements of the application before committing to a purchase. Scanning parts in general is all about speed and productivity.

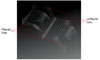
Laser scanning technology has emerged as an increasingly popular solution for many measurement applications. Source: Hexagon Metrology Inc.
A: These two terms are sometimes used interchangeably, but they are separate processes. Inspection, or validation, is the measurement of actual dimensional features. The end result can yield a traditional inspection report much the same as from a coordinate measuring machine (CMM) or other tactile inspection device. Another end result is a point-cloud to computer-aided design (CAD) comparison. This process compares a digital CAD model to the scanned physical part by generating a “color map” or “weather map” picture of the comparison.
Scanning for reverse engineering is typically used to re-engineer a part, meaning to create 3-D data where none existed. Common applications are for rapid prototyping, copy milling, archiving and competitive analysis.
Q: What factors should I consider when choosing between a scanner on a stationary CMM or on a portable CMM?
A: Generally speaking, portable CMMs can be taken to a part or assembly in most any environment, providing a faster and more convenient way to gather data. If the application has repetitive inspection requirements on smaller parts, a stationary CNC CMM is a better choice.
Filtered data is the raw sensor data that has been filtered as the point cloud is being generated. Unfiltered data is sensor data in its raw state, which represents the sensor’s true ability to accurately scan and compare true data to nominal data. Source: Hexagon Metrology Inc.
A: Certain lighting conditions or material types may make it difficult for the sensor to accurately read the laser beam bouncing off the part. But for laser scanners incorporated into any type of automated assembly process monitoring systems, powdering the part is impossible. Even in conditions where it is possible to powder the part, it is still undesirable as it adds a step and time to apply the powder then clean the surface. Powder coating also adds up to a 100-micron non-uniform layer of thickness.
The ability of the scanner’s software to process the sensor feedback in real time, while conditions such as part surface and ambient lighting change, is called dynamic range. Surface conditions can include texture, color and finish (shininess). Ambient lighting such as halogen, mercury vapor, fluorescent and even sunlight all have different characteristics.
Any of these conditions can affect the sensor’s ability to scan the part surface. The best sensors on the market are able to compensate for these conditions automatically to obtain the best possible raw data without relying on smoothing algorithms to remove outliers caused by a poor sensor.

An example of good quality scan data, this indicates a scanner’s ability to handle reflective surface without powder spray. Source: Hexagon Metrology Inc.
A: Sensors that produce scans in the millions of points are a recent trend in the scanning industry. It is a fair question to ask why so many points are needed. The answer is simple: resolution. How scanning systems deal with resolution is not so simple and can be misleading.
There are many benefits to scanning and one of them is the ability to gather data on 100% of the part. This means that when using conventional tactile methods, only portions of the part surface or feature are actually inspected. For example, a minimum of four points are taken to measure a plane with a tactile CMM. One swipe of a laser scan line will produce thousands of points that can be used to calculate the plane. The process of verifying high curvature areas on an object can benefit by having 100% of the surface inspected as opposed to gathering just a few dozen points.
So does a scanning system use all the points or does it throw out points? This involves an aspect of scanning known as filtered data. Filtered data is the raw sensor data that has been filtered as the point cloud is being generated. This is typically performed by third-party point cloud software packages as the data is captured by the software “live” from the sensor.
The third-party software tries to compensate for poor quality data, caused by conditions such as surface conditions, poor resolution or other sensor deficiencies. This compensation is done by filtering or smoothing the data-it is in effect being manipulated prior to use-thereby data quality becomes dependent on the smoothing algorithms.
Unfiltered data is sensor data in its raw state, which represents the sensor’s true ability to accurately scan and compare true data to nominal data.
Another way of looking at resolution is to consider the difference between photographs taken with a camera phone vs. a 10-megapixel digital camera. The faces can be recognized in both images, but the 10-megapixel version is much clearer and better quality. There is no way to improve the quality of the camera phone image because the data isn’t there due to poor resolution.
So if high density data is good when characterizing complex features, when is high density data unnecessary? If a part contains large flat areas with no features and no particular change in characteristics, it is not necessary to collect so much data because this leads to unnecessarily large data files and increased processing time due to the extra points.
Some scanning systems are capable of adapting the number of points collected dynamically based on the nature of the surface-collecting more points on surfaces with a high degree of change (highly complex curvature) and fewer points in flat areas.

Here is an example of good resolution (using all points) scan data on a 15 millimeter hole. This is an example of poor resolution (not using all points or poor resolution sensor) scan data on a 15 millimeter hole. Source: Hexagon Metrology Inc.
A: Mostly, it is the fact there’s currently no industry standard governing scanning devices. Consequently, scanner OEMs have latitude to publish whatever specs they choose. This makes it difficult to compare systems with any degree of confidence. Terms such as accuracy, resolution and repeatability are not always used consistently.
To further confuse things, the issue of filtered vs. unfiltered data also enters into the scanner spec discussion. Recall, filtered data is sensor data that has been filtered or smoothed as the point cloud is being generated. Therefore, the raw sensor data is altered, making data quality unknown and making it difficult to compare scan data between devices.
Unfiltered data provides a true picture of the capability of the sensor to accurately scan, and thus compare, true data to nominal CAD data.
Q: What does the two-Sigma accuracy test mean?
A: Technically it is a statistical method to determine how much deviation error exists in a set of data (two standard deviations). Scanner accuracy specifications are typically expressed in terms of the degree of confidence that the sample falls in a defined region of a normal distribution curve.
Standard deviation is used frequently to measure process, performance, etc., but for metrology equipment, the Sigma value is stated as a measure of accuracy and repeatability. In a scanning application, for example, a two-Sigma indicates a 95.44% probability that points collected will fall within the distribution curve (compared to the nominal).
In scanning sensor terms, a 24µm@2σ specification would mean that the sensor will be accurate to within 24 microns for measuring a feature within its field-of-view with a confidence level of 95.44%.
Some scanners quote accuracy and repeatability specifications without specifying a Sigma value so while the accuracy number seems good, there is no stated confidence as to how many points will fall within the distribution curve, meaning that only a few data points might meet the stated accuracy but a large number of data points might not.

This picture shows an example of measuring a flat plane (the horizontal blue line). The top scan has been filtered or smoothed so the results look quite good. However, the data is inaccurate, because the data does not fit the plane. The scan cloud at the bottom may not look as nice, but the accuracy to the plane is better. The lesson is the prettiest picture is not necessarily the best result. The only true way to compare scanner-for-scanner is by using raw scan data. Source: Hexagon Metrology Inc.
A: This is a difficult question to answer. There are many types of scanners on the market today using different technologies and mounted to different types of carriers. Most require a reference positioning system such as a portable arm, CMM or laser tracker. Using a positioning device means the system is reliant on the accuracy of both the positioning device and the scanner.
In order for a system to be accurate, it should start with the scanner. Ideally, the specification should start with calibration equipment that is traceable to a standards body such as NIST, and uses a reference target that is three-dimensional, not a one-dimensional flat plane. Any scanner will have great results on a flat plane, but the true capability of a scanner lies in its ability to scan three-dimensionally, particularly in the Z (depth) dimension.
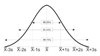
Scanner accuracy specifications are typically expressed in terms of the degree of confidence that the sample falls in a defined region of a normal distribution curve. Standard deviation is used frequently to measure process, performance, etc., but for metrology equipment, the Sigma value is stated as a measure of accuracy and repeatability. In a scanning application, for example, a two-Sigma indicates a 95.44% probability that points collected will fall within the distribution curve (compared to the nominal). Source: Hexagon Metrology Inc.
Q: If you had one piece of advice for someone looking to purchase a scanning solution, what would it be?
A: Get a product demo of the scanner using your parts. Never buy a scanning system on the basis of a canned demo on a demonstration block. Q
Tech Tips
Quality Online
For more information on laser scanning, visit www.qualitymag.com to read the following articles:Looking for a reprint of this article?
From high-res PDFs to custom plaques, order your copy today!


.webp?height=200&t=1745868355&width=200 "Cardinal Manufacturing At Eleva-Strum High School")