Do Your Materials Measure Up?

Materials testing is often the last step in the manufacturing process. Yet, quality is the result of both the process and the material. If the material that goes into the product is defective, then the product may be defective. Quality cannot be put in after the fact.
In forming materials, understanding the material's properties can help to better predict the manufacturing outcome. For stamping and forming operations and for many products, a profile of the material will help detect variations in materials from suppliers.
In fact, many of the most often-used metals and many plastics, polymers, textiles and composites exhibit Hookean behavior, which means the stress in a material is proportional to the strain that produced it. For manufacturers, it is of the utmost importance to understand the mechanical properties of materials that exhibit some Hookean behavior during loading.
It is important because the performance of a structure is frequently determined by the amount of deformation permitted. A deflection of a few thousandths of an inch in an optical grinding machine will produce scrap lenses, whereas a bridge truss or joist might deflect several inches. Some measured properties that must be considered when designing a structure include tensile strength, yield strength and Young's Modulus of Elasticity.
Another important property is ductility, which is the ability for plastic deformation in tension or shear. Ductility controls the amount a material can be cold formed, which is the process used when forming automobile bodies or wire products. Two commonly used indices of ductility are total elongation and reduction of area. For suppliers, the mechanical properties are an important measure of product quality, and buyers often require certification of the values.
The outcome of a forming process depends on both material characteristics and process variables such as strain, strain rate and temperature. Stress and strain fields are so diverse during a forming process that one test cannot be used to predict the formability of materials in all situations. However, an understanding of material properties is necessary to determine if a forming process will be successful.
Material properties that have a direct or indirect influence on formability and product quality are tensile strength, yield strength, Young's Modulus, ductility, hardness, the Strain Hardening Exponent and the Plastic Strain Ratio. All of these parameters, except hardness, can be determined by cutting a test specimen from a blank and doing a tensile test.
A tensile test generates a stress-strain curve that shows a graphical description of the amount of deflection under load for a given material. A typical stress-strain curve, as shown in the chart, "Stress-Strain Curve," depicts several key measures of product quality including total elongation, proportional limit, offset yield, yield by extension under load, tensile strength and the point of fracture.
The Tensile Test
The stress-strain curve is generated by pulling a metal specimen in uniaxial tension to failure. ASTM E8/E8M Standard Test Methods for Tension Testing Metallic Materials governs the methods used for the determination of yield strength, ultimate tensile strength, percent elongation at break and reduction of area. Other ASTM specifications apply to nonmetals; however, the required calculations are similar in principle.
Here are some of the calculations:
Engineering stress (S) is obtained by dividing the force (F) at any given time by the original cross sectional area (Ao) of the specimen.
S = F/Ao
Engineering strain (e) is obtained by dividing the elongation of the gage length of the specimen (ρl) by the original gage length (lo).
e = ρl/lo = (l - lo)/lo
The shape and magnitude of the curve depend on the type of metal being tested. In Figure 1, point A represents the proportional limit of a material. A material loaded in tension beyond point A, when unloaded, will exhibit permanent deformation. The proportional limit is often difficult to calculate, therefore, two practical measurements, offset yield strength and yield by extension under load (EUL), were developed to approximate the proportional limit. The initial portion of the curve below point A represents the elastic region and is approximated by a straight line. It is commonly referred to as the linear elastic or Hookean region. The slope (E) of the curve in the elastic region is defined as Young's Modulus of Elasticity and is a measure of material stiffness.
E = ρS /ρe = (S2-S1)/(e2-e1)
Point B represents the offset yield strength and is found by constructing a line X-B parallel to the curve in the elastic region. In other words, the slope of line X-B is equal to Young's Modulus (E). Line X-B is offset a strain amount O-X, which is typically 0.2% of the gage length (O-X = 0.2% = 0.002 in./in.; for a 2 in. gage length = 0.004 in.).
Point C represents the yield strength by extension under load (EUL) and is found by constructing a vertical line Y-C. Line Y-C is offset a strain amount O-Y that is typically 0.5% of gage length. The tensile strength or peak stress is represented by point D.
Elongation at fracture is the amount of uniaxial strain at fracture and is depicted as strain at point Z. It includes the amount of both elastic and plastic deformation just prior to the sudden decrease in force associated with fracture. Elongation at fracture is generally measured with an extensometer that remains on the specimen through break. For materials that exhibit a high degree of elongation, such as plastics, crosshead travel may be substituted for direct strain measurement with an extensometer. Percent elongation at break is commonly determined after the test by fitting the fractured ends together and measuring the change in gage length, lo, between two gage marks that were punched or scribed into the specimen prior to testing. (The gage length used for measurement is reported with
the result.)
Elongation at Break (%) = ez = 100* (lz-lo)/lo
Reduction of area like elongation at break is another measure of ductility and is expressed in percent. Reduction of area is calculated by measuring the cross-sectional area at the fracture point.
Reduction of Area (%) = (Ao-Az)/Ao
Mechanical Properties
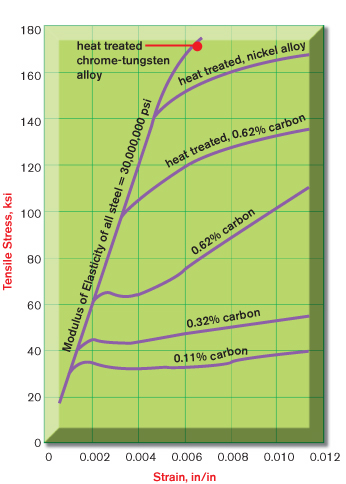
Different types of steels have different stress-strain curves, as shown in Figure 2. The yield strength of 0.11% carbon steel is half the yield strength of 0.62% carbon steel. After the onset of yield, 0.62% carbon steel exhibits a great deal of strain hardening whereas 0.11% carbon steel exhibits little strain hardening.
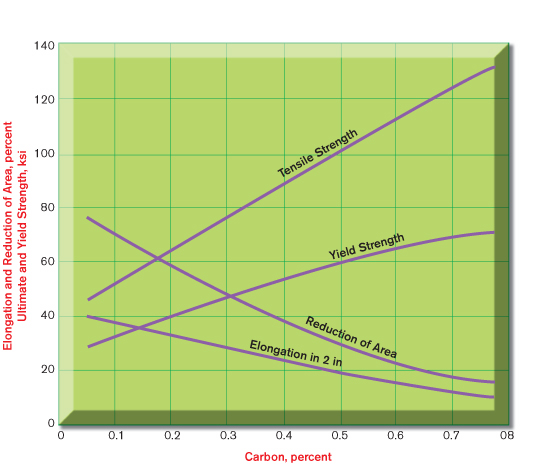
As the carbon content of steel varies, the magnitudes of tensile strength, yield strength, elongation and reduction of area also change, as shown in Figure 3. By observing Figure 3, it is seen that tensile strength and yield strength increase (material becomes stronger) when more carbon is added whereas reduction of area and elongation decrease (stretches less).
In general, as reduction of area increases, the minimum allowable bend radius for a sheet material decreases. Therefore, as the carbon content of steel increases, the minimum bend radius increases.
Yield strength and tensile strength are not directly related to formability. However, the closer the magnitude of the two stresses, the more "work hardened" the metal. Therefore, as the carbon content of steel decreases, the material appears as if it is more work hardened.
Both elastic and plastic deformations occur during a forming process. Upon removal of the external forces, the internal elastic stresses relax. If the forming process is not designed correctly, the stress relaxation or "springback" will cause the part to change shape or distort. A material with a lower value for Young's Modulus, E, and/or a higher value for yield strength, will exhibit greater "springback" or shape distortion. Therefore, as the carbon content of steel increases, the amount of "springback" increases.
Points to Ponder
Manufacturers must keep several points in mind when testing to get the most accurate and predictable results.
• Elongation at fracture and reduction of area both increase by increasing the cross-sectional area of the specimen. Percent elongation decreases with increasing gage length because the region in which localized necking occurs always remains the same regardless of the gage length. Therefore, consistency in specimen dimensions and gage length are paramount for comparing results and ensuring process quality.
• The rate at which a test is performed can have a significant effect on tensile properties and is known as strain-rate sensitivity. Tensile properties for plastics and polymers are sensitive to testing rates. Steels are also sensitive to strain rates, but aluminum alloys have little sensitivity. Materials that are sensitive to strain rates exhibit higher tensile strengths and lower elongation at faster speeds. Therefore, it is important that all testing rates are within the limits specified by the governing standard. If comparing results across lots or batches of like materials, insist that the testing rates are identical.
• During the rolling process used to produce metals in sheet form and the subsequent annealing, the grains become elongated in the rolling direction, resulting in an anisotropic material. This causes a variation in tensile properties when the direction of loading is changed in relation to the orientation of the grains. Therefore, it is common practice to test specimens cut parallel to the rolling direction and at 45 degrees and 90 degrees to this direction and include the direction with the results.
• One of the most frequent calls to customer support is from manufacturers who believe that their yield strength and modulus values are not correct. After obtaining a copy of the stress-strain curve, it is determined that the strain extensometer has slipped on the specimen at some point in the linear elastic region. There are several reasons why slippage may occur, chief among them are: the specimen has not been prepared correctly or is bent; the gage length stop is out of adjustment; the knife edges are worn; the clamping force is too small; or the extensometer is damaged. It is recommended that a maintenance program based on the frequency of extensometer use be instituted.
• Often the strain goes negative or a slight amount of extensometer slippage occurs just after loading begins. As a result, errors may occur in programs that automatically calculate modulus. To eliminate the strain of non-linearity in the elastic region, raise the logging threshold in the testing software.
Tech Tips
1. Many of today's most often used metals, plastics, polymers, textiles and other materials exhibit Hookean behavior.
2. Understanding the mechanical properties of materials can help predict the quality of a final product.
3. Steel has different stress-strain curves. For example, the yield strength of 0.11% carbon is half that of 0.62% carbon steel.
4. The performance of a structure is frequently determined by the amount of deformation that can be permitted.
5. As carbon content varies, the magnitudes of tensile and yield strength, elongation, and reduction of area also change.
Looking for a reprint of this article?
From high-res PDFs to custom plaques, order your copy today!


