Improve Gage R&R Ratios
Gage Repeatability and Reproducibility (GR&R) studies provide information on measurement system performance by using ratios of measurement variation and part tolerance gathered from multiple part and operator measurements. If measurement variation can be reduced and GR&R ratios improved, it is easier to differentiate between parts that are in or out of specification, allowing parts to be accepted or rejected with greater confidence.
In GR&R studies, several ratios are calculated. Two of the most important ratios are measurement variation to part tolerance and measurement variation to total variation.
The first ratio, the ratio of measurement variation to part tolerance, represents how well it can be determined whether a part is in specification. If the measurement error is too large, poor parts will be accepted and good parts rejected.
The second ratio, the ratio of measurement variation to total variation, represents how easy it is to distinguish between different parts. If the measurement variation is large compared to the total variation, the process cannot be monitored with control charts-the noise will obscure the data.
No hard and fast rules are set for determining the acceptable level of part tolerance that is lost to gaging error and knowing when sources of variation need to be reduced to improve the GR&R ratio. Often GR&R ratios need to be improved in marginal manufacturing processes because the manufacturing variability in these steps takes up much of the tolerance. In other cases with a tight tolerance, only a small percentage is acceptable. The following rules are widely accepted, but may be subject to supplier approval:
• If the GR&R as a percentage of the tolerance is 10% or less, the gaging system is acceptable.
• If the GR&R as a percentage of the tolerance is 11% to 29%, the gaging system may or may not require further analysis to find the sources of measurement error.
• If the GR&R as a percentage of the tolerance is 30% or greater, the gaging system needs further analysis to find the sources of measurement error.
Other Tools
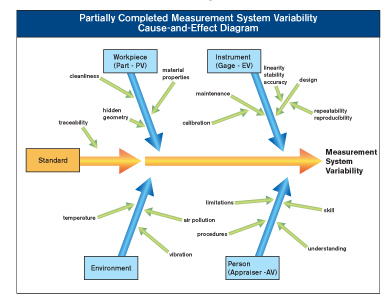
By using other quality assurance tools in conjunction with GR&R studies, measurement variation can be reduced to provide more precise measurements by identifying sources of error and by reducing their contribution. One of these quality assurance tools, Ishakawa Cause and Effect diagrams, provide a useful tool in helping identify sources of variation for the measurement process. Often referred to as fish-bone diagrams, the cause-and-effect diagrams provide a graphical means to list and identify causes that affect a result, which are often processes or outcomes. Generally, cause-and-effect diagrams have four major components that affect the result: operator, method, machine and material. For GR&R studies, these categories can be fine tuned to help identify measurement system variability. The AIAG's Measurement Systems Analysis Reference Manual recommends five categories:
• Instrument (Gage)
• Workpiece (Part)
• Standard
• Environment
• Person (Appraiser)
Although several methods are used to perform and calculate GR&R study results, most methods share three components that contribute to the observed measurement variation for the study: appraiser variation (AV), equipment variation (EV) and part variation (PV). These contributors of variation and the tester's knowledge of the measurement process help identify sources of variation and improve the GR&R ratio. For clarity, see the diagram, "Partially Completed Measurement System Variability," which uses the five categories.
To use a cause-and-effect diagram, first ensure that the measurement process is in statistical control. One method to do this is to do many studies over time and plot them on a statistical process control chart and establish control limits. If the chart does not exhibit being in control, or if there might be special cause variation in the measurement process, the cause-and-effect diagram can be used to find the source of the special-cause variation. Typically, cause-and-effect diagrams work best if a group of individuals who are familiar with the complete measurement process meet and brainstorm the specific measurement process that needs to be brought into control or improved.
After the measurement process is known to be in statistical control and the GR&R ratio is identified as too large, or needs to be improved, hold a meeting. Using a whiteboard, draw the cause-and-effect diagram listing each potential source of variation under a category.
Examining the error components, AV, EV and PV can guide the search for areas needing improvement. In most instances, look at the component that has the highest component of variation and for the source of variation that makes the component variation higher than the others.
Suppose the AV is large for a multi-operator study as compared to other components, it indicates that the reproducibility component might be causing the major source of variation. Look at the cause-and-effect diagram and see what measurement variations can be caused by the appraisers. To find differences between appraisers, it may be worthwhile to have an auditor review the cause-and-effect diagram and then audit the GR&R procedure for the different appraisers. Familiarity with a process sometimes leads to overlooking fine points that can lead to large differences, such as warm-up time, Measurement and Test Equipment (M&TE) or measurement approach direction, which might actually be a source of EV. For automatic gaging systems, reproducibility might show up as an AV component indicating that multiple fixtures may be the source of variation. When listing potential sources of variation, these sources may be obvious or may spur further analysis to find the variation source.
For each GR&R study, the cause-and-effect diagrams may be similar, but for each type of M&TE there is often a different measurement procedure and a fundamental difference in sources of variation caused by the M&TE operational characteristics. It is in these cases that the cause-and-effect diagram has the greatest potential to bring to light EV variation sources. By examining the cause-and-effect diagram, it may even become clear that the M&TE selected may not be well suited for the measurement task.
GR&R studies form an important part of the inspection and test process. By reducing the GR&R ratio, there is a better ability to differentiate between parts that are in or out of specification.
Tech Tips
1. If measurement variation can be reduced and GR&R ratios improved, there is a better ability to differentiate between parts that are in or out of
specification.
2. Two important ratios are measurement variation to part tolerance and measurement variation to total variation.
3. Cause-and-effect diagrams provide a tool to help establish and visualize measurement process error components.
Looking for a reprint of this article?
From high-res PDFs to custom plaques, order your copy today!


