Quality Software & Analysis: Analyzing Value Streams
Value stream attribute mapping presents a new way to characterize value streams.
While training and facilitating value stream improvement teams, it has become apparent that there should be an easier, leaner way to characterize the flow of value through an organization.
While training and facilitating value stream improvement teams, it has become apparent that there should be an easier, leaner way to characterize the flow of value through an organization. The traditional method has been through the use of customized flow diagrams with specific icons developed for value stream applications. The Value Stream Attribute Mapping (VSAM) method has several advantages over the traditional method:
These improvements result in the VSAM method taking less time to complete, particularly for more complex value streams, while incorporating built-in data accuracy and richness. The VSAM method increases both the amount and quality of the useful attribute data. This new method is computer-based employing software that is widely used and understood.
The improvement teams intuitively understand the resulting modular design of the value stream attribute map. The "fill-in-the-blanks" approach allows them to characterize and analyze their current state quickly and move on to designing the future state where the real "gold" lies.
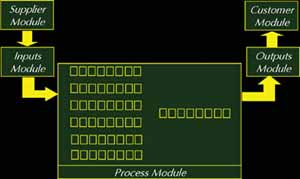
The VSAM is constructed in five modules-Suppliers, Inputs, Process, Outputs and Customers. The modules are laid out in a logical graphical framework. The improvement team completes each module in sequence or in parallel-using subteams-with attributes data collected prior to the mapping session. The results of this current state map, along with the subsequent value-added decomposition analysis allow the team to envision the vastly improved process future state.
The Suppliers Module details the following attributes:
Note the circular nature of this process-that is, customers also are suppliers, usually supplying information such as orders.
The parallel process streams are referred to as tributaries and the final processes as the final stream. A tributary may feed any step or steps in the final stream or another tributary. Arrows should be drawn to indicate this flow relationship. Each process step is characterized in a three-part process box describing operations, movement/storage activities and inspection activities.
The base template allows for up to six process tributaries of up to eight steps each and a final stream of up to six steps. However, this base template can be expanded into more tributaries or steps to fit the needs of any given value stream.
The final process box of each tributary and the final two process boxes of the final stream automatically calculate tributary totals, final stream totals and value stream totals respectively for the following attributes:
In the interest of time and efficiency, it is a good idea to divide and conquer the completion of the Process Module. Use subteams of two or three improvement team members to complete each of the tributaries and the final stream process boxes. If possible, assign the subteams based on their expertise in the tributary or final stream being mapped.
The Customers Module details the following attributes:
Structure the mapping activity with at least three subteams assigned initially to completion of the VSAM-one assigned to suppliers, one to customers and one to process. If the team is large, additional subteams can be assigned to the appropriate tributary or final stream of the Process Module to speed up the mapping. Alternatively, for smaller teams, the subteams initially assigned to suppliers and customers can assist with completion of the process module after they have completed their initial tasks.
After all of the modules are completed with the appropriate attributes, print the VSAM and post it on the wall so the team can refer to it as needed during the remainder of the improvement project. This can be done on standard 8.5- by 11-inch paper on a color printer. For the Process Module it is even better if access to a color plotter is available so it can be printed on one sheet.
Using VSAM, expect to complete a mapping activity, either current or future, in less time, with less waste and with more efficient use of team resources, which is a good, short description of a lean process-the primary intention of the VSAM approach. This "new idea" in mapping value streams can help a manufacturer get to a future lean enterprise state faster, with less wasted time, and with more effective, better designed improvements.
While training and facilitating value stream improvement teams, it has become apparent that there should be an easier, leaner way to characterize the flow of value through an organization.
The VSAM Modules
Source: Juran Institute
Source: Juran Institute
While training and facilitating value stream improvement teams, it has become apparent that there should be an easier, leaner way to characterize the flow of value through an organization. The traditional method has been through the use of customized flow diagrams with specific icons developed for value stream applications. The Value Stream Attribute Mapping (VSAM) method has several advantages over the traditional method:
- The map is computer-generated, alleviating concerns that teams often have about their ability to make hand-drawn maps "pretty" and accurately reproduce the specified icons.
- Process attributes such as cycle time, available time, move and storage time, and in-process inventory quantities are recorded in logical, proximate places on the map. This makes it easier to access the correct data for calculation of overall process attributes such as lead time.
- Calculations of the overall process attributes are done automatically in the model instead of with a calculator. This leads to fewer errors in calculation and a reduction of wasted time.
- Greater emphasis is placed on important process attributes related to equipment efficiency, product quality and product movement.
- The VSAM method is much easier to apply and understand in a parallel process, for example, in a subcomponents feeding assembly operations environment. This type of process environment is the most common application for mapping.
These improvements result in the VSAM method taking less time to complete, particularly for more complex value streams, while incorporating built-in data accuracy and richness. The VSAM method increases both the amount and quality of the useful attribute data. This new method is computer-based employing software that is widely used and understood.
Starting Point
The starting point for VSAM is the Suppliers-Inputs-Process-Outputs-Customers (SIPOC) model widely used for high-level process mapping. This model fits well with the information needs of a value stream map and the thought process involved is easy to understand.The improvement teams intuitively understand the resulting modular design of the value stream attribute map. The "fill-in-the-blanks" approach allows them to characterize and analyze their current state quickly and move on to designing the future state where the real "gold" lies.
The VSAM is constructed in five modules-Suppliers, Inputs, Process, Outputs and Customers. The modules are laid out in a logical graphical framework. The improvement team completes each module in sequence or in parallel-using subteams-with attributes data collected prior to the mapping session. The results of this current state map, along with the subsequent value-added decomposition analysis allow the team to envision the vastly improved process future state.
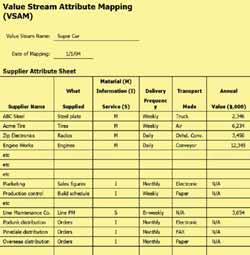
Suppliers Module
Source: Juran Institute
Source: Juran Institute
Suppliers Module
As with all of the VSAM modules, the suppliers' attributes are entered into a preformatted Microsoft Excel spreadsheet. This module incorporates a broader view of suppliers-more than just suppliers of materials but also of information and services. These materials, information and services are automatically duplicated as the "inputs" in the Inputs Module.The Suppliers Module details the following attributes:
- Supplier name-who supplies the material, information or service.
- What supplied-a description of the material, information or service.
- Material (M), Information (I), Service (S)-the description of what is supplied.
- Delivery frequency-how often the item is supplied.
- Transport mode-how the item is transferred from supplier to receiver.
- Annual value-the value, in terms of dollars, of the material or service that is supplied; this is not applicable to information supply.
Note the circular nature of this process-that is, customers also are suppliers, usually supplying information such as orders.
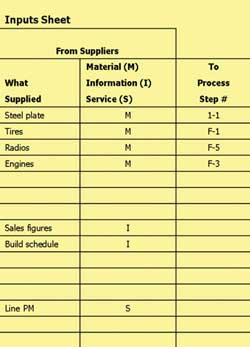
Inputs Module
Source: Juran Institute
Source: Juran Institute
Inputs Module
Most of the entries for the Inputs Module, such as What Supplied and Material (M), Information (I) and Service (S), automatically replicate from the Suppliers Module. The only information that must be entered in this module is the "To Process Step #" column. This information represents the location in the Process Module, either process tributary or process final stream that receives the input. As such, this final column cannot be completed until the Process Module has been completed.Process Module
The Process Module is where the action lies. This portion of the map is the most information and opportunity rich of the five modules. The structure allows for documenting parallel processes, usually subcomponent manufacturing, and a final set of processes, usually assembly operations.The parallel process streams are referred to as tributaries and the final processes as the final stream. A tributary may feed any step or steps in the final stream or another tributary. Arrows should be drawn to indicate this flow relationship. Each process step is characterized in a three-part process box describing operations, movement/storage activities and inspection activities.
The base template allows for up to six process tributaries of up to eight steps each and a final stream of up to six steps. However, this base template can be expanded into more tributaries or steps to fit the needs of any given value stream.
The final process box of each tributary and the final two process boxes of the final stream automatically calculate tributary totals, final stream totals and value stream totals respectively for the following attributes:
- Operation cycle time
- Setup time
- Available time
- Rolled throughput yield
- Capacity, in pieces per day
- Number of operators
- Move/store time
- Move distance
In the interest of time and efficiency, it is a good idea to divide and conquer the completion of the Process Module. Use subteams of two or three improvement team members to complete each of the tributaries and the final stream process boxes. If possible, assign the subteams based on their expertise in the tributary or final stream being mapped.
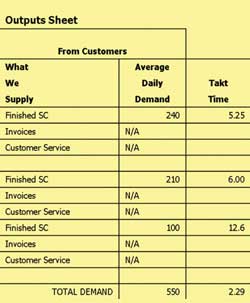
Outputs Module
Source: Juran Institute
Source: Juran Institute
Outputs Module
Similar to the Inputs Module that replicates some of the Supplier Module information, the Outputs Module replicates many of the customer attributes. As such, the Customers Module must be completed before the Outputs Module will populate with data. The remaining column of information is takt time, which is automatically calculated by the spreadsheet. Takt time is computed both by individual customer-which is useful where distinct options or models are sent to different customers-and in aggregate.Customers Module
Source: Juran Institute
Source: Juran Institute
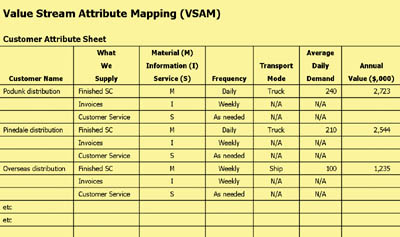
Customers Module
The final element in the SIPOC structure of the map is the Customers Module. This module, similar to the Suppliers Module, takes a broad view of the value stream's customers as being those entities that are supplied with materials, information or services.The Customers Module details the following attributes:
- Customer name-to whom the material, information or service is being supplied.
- What supplied-a description of the material, information or service.
- Material (M), Information (I), Service (S)-a description of what is supplied.
- Delivery frequency-how often the item is supplied.
- Transport mode-how the item is transferred from the manufacturer to the customer.
- Average daily demand-on average, how much the customer purchases each day. This attribute may not be applicable to information or service supply, but can be used for these types if they are the value stream's product.
- Annual value-in dollars, the value of the material or service that is supplied; this is not applicable to information supply.
Logistics
It is important to note that because of the information links between the five modules, the SIPOC order cannot be followed when completing the VSAM modules. The suggested order of completion is: Suppliers, Customers, Process, Inputs and Outputs. Other orders would work as long as the inputs are done after the suppliers, and customers before outputs.Structure the mapping activity with at least three subteams assigned initially to completion of the VSAM-one assigned to suppliers, one to customers and one to process. If the team is large, additional subteams can be assigned to the appropriate tributary or final stream of the Process Module to speed up the mapping. Alternatively, for smaller teams, the subteams initially assigned to suppliers and customers can assist with completion of the process module after they have completed their initial tasks.
After all of the modules are completed with the appropriate attributes, print the VSAM and post it on the wall so the team can refer to it as needed during the remainder of the improvement project. This can be done on standard 8.5- by 11-inch paper on a color printer. For the Process Module it is even better if access to a color plotter is available so it can be printed on one sheet.
Using VSAM, expect to complete a mapping activity, either current or future, in less time, with less waste and with more efficient use of team resources, which is a good, short description of a lean process-the primary intention of the VSAM approach. This "new idea" in mapping value streams can help a manufacturer get to a future lean enterprise state faster, with less wasted time, and with more effective, better designed improvements.
Links
Looking for a reprint of this article?
From high-res PDFs to custom plaques, order your copy today!


