Quality Masurement: Assessing Multisensor Measurement Accuracy
Whenever operators ask, "What is the accuracy of your multisensor machine?" Technically, an accurate answer is, "Excellent." This surprises many people who are expecting a quantitative "±X-type" answer. But, the correct definition of measurement accuracy, by international agreement, is "closeness of the agreement between the result of a measurement and a true value." An accompanying note states, "accuracy is a qualitative concept." This means that words like good, better, best and excellent-are the correct way of expressing accuracy.
In fact, assigning numerical values to accuracy is described by no less an authority than the British National Measurement Laboratory as strictly a marketing activity! The numerical values questioners are really seeking are called uncertainties.
The actuality of uncertainty
Uncertainty of measurement is defined in the International Vocabulary of Basic and General Terms in Metrology (VIM) as a "parameter, associated with the result of a measurement, that characterizes the dispersion of the values that could reasonably be attributed to the measurand." Typically this is expressed as M ± U, where M is the best estimate of the value of the quantity being measured-the measured-and ± U represents a range of nearby values likely to include the true value of the measurand. Smaller U values mean the measurement is better, or equivalently, the measurement accuracy is-qualitatively-higher. For a more detailed explanation of uncertainty, visit the National Institute of Standards and Technology Web site at: http://physics.nist.gov/cuu/Uncertainty/index.html.
To more clearly visualize these ideas, recall the familiar "bull's-eye" picture frequently used to illustrate the concepts of repeatability and bias. This drawing assumes that we know the actual true value. But since that is physically impossible, the more correct picture today recognizes a zone centered on our actual measurement results. The size of this zone is our uncertainty. We use our best knowledge of the measurement process and related conditions to estimate this uncertainty value. We assert with confidence that the true value is within this zone, even though we do not know exactly where.

Measurements vs. Instruments
A key part of uncertainty is the phrase "associated with the result of a measurement." This means that a measuring device cannot really have an uncertainty by itself. This is true whether the device is a micrometer, a voltmeter or a multisensor machine. Uncertainty only can correctly be given for the result acquired by using the instrument to make a particular measurement with a defined measurement process.However, we know from long experience that some instruments are consistently better than other instruments-or, that in most cases, one instrument will be better for certain measurements while a different instrument will be better for other measurements. Being "better" simply means having a smaller uncertainty for a particular measurement. Of course, other qualities such as speed and cost influence our assessment of "better" in addition to accuracy. Precisely because the actual uncertainty is associated with a particular measurement, one instrument may have a lower uncertainty for the measurement of quantity, diameter, while another instrument may have a lower uncertainty for measurement of another, roundness, when measuring the same object.
Because uncertainty really applies to a specific measurement result, manufacturers cannot just assign-or advertise-an uncertainty value for an instrument. What we can do is report uncertainties for particular measurements under known conditions, limiting the influence of external error sources such as the environment. This gives values for particular measurement tasks, or the "intrinsic uncertainty" of an instrument, a concept derived from the "intrinsic error of an instrument" defined in VIM. For commercial purposes, manufacturers typically use knowledge of their instruments' intrinsic uncertainties and publish a slightly larger value as the "maximum permissible error" (MPE) for acceptance testing of the instrument. Just to confuse matters more, these published values are usually called "uncertainties."
The role of standards
If everyone uses a different measurement to evaluate instruments' intrinsic uncertainty, the results cannot be compared. Solving this issue is what documentary standards do for us-provide a set of standard measurements for everyone so we can compare apples to apples for different instruments. In the world of CMMs with contact probing, we have well-established standards written around the uncertainty of specific length measurements, plus measurements showing form and size errors from probing effects. The range of these latter errors from the probing system may be combined with the length uncertainty to estimate uncertainties for other types of measurements. This approach was chosen as a consensus compromise, trading off the amount of time spent evaluating a machine's intrinsic uncertainty against the level of detail in our knowledge of that uncertainty.Standards for multisensor machines
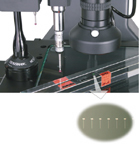
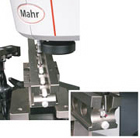
There are currently no standards for multisensor machines. VDI/VDE in Germany has published 2617-6 for CMMs with optical sensors. ASME in the U.S. and ISO currently have draft standards for CMMs with optical sensors, but these will probably not be completed and published before late 2006. Additional error sources from using true multisensor systems, which we call "sensor fusion errors," are not even being addressed in working drafts yet. Sensor fusion errors include effects from mixing data taken with two or more types of sensors in determining a measurement result. These errors fall into two classes, those that use individual points from multiple sensors to determine a single geometric element and those that determine relationships between multiple geometric elements, each of which was individually measured by a different sensor.
Currently the manufacturers of multisensor machines and plain optical CMMs without multisensor capability, have taken a variety of approaches to presenting the "accuracy" of their machines. These are mostly variations of ISO 10360-2, but they present some real problems for optical systems. Multisensor machines that include contact probes as well as optical probes can run the real standard tests using only their contact probes, which gives an excellent baseline number for the machine. Machines that do not include contact probes often run a private variation of ISO 10360-2, usually performing only the length measurements and ignoring the required probe error testing. Even length testing is problematic for optical-only machines, since typical optical length standards do not work very well in three dimensions.
Multisensor difficulties
The most common error in implementing an approximate ISO 10360-2 test with an optical sensor is only measuring an optical length standard, such as a line scale, in horizontal orientations at multiple heights. Inclining these standards out of the horizontal plane often causes measurement problems and additional uncertainty. However, only measuring in horizontal planes misses one of the most important systematic errors in coordinate measurement-the small non-perpendicularity of the vertical axis to the machine horizontal plane, which the 10360 standard was carefully designed to catch.Even worse is measuring the optical standard only in a single horizontal plane, which misses numerous errors because of the geometric imperfections of the horizontal motion axes. An especially pernicious version of this is the so-called "map and check" trick of a few unscrupulous machine calibrators. Many machines are error mapped to improve their accuracy. However, an incomplete or incorrect mapping procedure usually has the effect of making the machine more accurate in areas where the mapping data was collected and much less accurate elsewhere in the machine's working volume. The trick is to map in one area, such as at the optical table surface, and then only perform an acceptance test in the same area. The machine appears exceedingly accurate, but in fact at higher planes or along inclined directions, the errors can actually be greater than if no mapping had been performed.
Another common difficulty in using the 10360-2 tests arises from optical averaging. The 10360-2 tests were intentionally designed to be sensitive to the single point repeatability of contacting probes, as this characteristic is often a limiting factor in the uncertainty of a CMM measurement. Fortunately or unfortunately, video-based optical sensors capture an entire image and use algorithms to extract a large number of edge or surface points from a single image. From these numerous raw extracted points, the operator then can choose from among a multiplicity of methods to determine a single point of interest.
Some of these methods simply select one point, which nearly approximates the original single point repeatability of a contacting probe, but may not be appropriate for a system intended to use averaging for its lowest uncertainty work. However, other point determination methods use all of the appropriate points in an entire image to find a "best-fit" point instead of an actual point. This gives a more stable, and usually more accurate result, but depends on the actual number of raw points in the image and on the details of the way the fitting is done. Unfortunately, some manufacturers use one method and some use another when executing their private version of 10360-2. Without knowing the full details of how the single points are determined for computing results in the 10360-2 tests, you have little real knowledge of the system's performance capability.
What's an operator to do?
Given the lack of real standards for comparing multisensor machines, potential operators of these systems are faced with incomplete and ambiguous information about measurement performance. In using uncertainty values-or even the so called accuracy numbers-to assess the performance of a multisensor machine, the following steps are prudent.1. Assess your real measurement needs for the system. Is 3-D measurement important in your application of the machine or will you primarily be using the system for two measurements in horizontal planes? Is the integration of contact probing and optical sensing important for your application?
2. Be sure to get complete specifications for the intended use of the system. If you have a 3-D application, be certain to obtain specifications that show the full 3-D measurement performance of the systems. Verify that these specifications include the errors because of vertical nonorthogonality to the horizontal measuring plane. Ask for probe (sensor) performance specifications, especially for optical probes.
3. Ask for details of the procedures for verifying the specifications. Length dependent uncertainty formulas-2.1 + L/250-generally are only standardized for contact probing. Ask for the full procedural details for assessing optical probing systems to be certain that all major error sources are rigorously evaluated. Pay careful attention to how "points" are determined and be certain that this approach is sensible for your applications. Inquire if software compensation techniques are used and whether they correctly account for all Z-axis errors.
4. Be a skeptic. In the end, understanding manufacturer specifications for multisensor measurements uncertainty depends on understanding precisely what the claimed numbers mean, and how they are relevant to your intended use of the multisensor system. Q
Tech tips
1. A key part of uncertainty is the phrase "associated with the result of a measurement."2. If everyone uses a different measurement to evaluate instruments' intrinsic uncertainty, the results cannot be compared.
3. If you have a 3-D application, be certain to obtain specifications that show the full 3-D measurement performance of the systems.
Looking for a reprint of this article?
From high-res PDFs to custom plaques, order your copy today!


