Quality 101: The Whys and Hows of Flowcharting
A flow chart should deliver instant knowledge relevant to what needs to be done at that moment, with complete reliability.

In the world of business, we all need to know what the sum of our efforts ultimately leads to. If we fail to understand this, our mental lives will be poorer, the results of our efforts will be substandard, and we will be inefficient operators-regardless of the very welcome pay check. Quality, along with profits, will most certainly suffer.
Meetings are no substitute for progress; however, knowledge-which springs from communication-is the key to achievement. We are all managers, as well as workers. Many of us are limited to managing how we use our own time; others manage and shape the way our whole business operates. The difference is in the detail of what information is needed to do the job and what one must impart to allow others to do theirs. The resulting knowledge base is the bedrock every company needs to prosper.
If the business is to succeed, one must ensure that access to this knowledge is fast, simple, current and relevant.
With this in mind, a flow chart is a great communication method. It is easy to interpret and it can be viewed by those who need it whenever they want. Developed in the right way-with good tools and in the right hands-flow charts will deliver much more than an illustration of the process. The flow chart should deliver instant knowledge relevant to what needs to be done at that moment, with complete reliability.
Mapping a process is actually quite simple, if done with the right tools. To make flow charts truly useful, create them with a systematic approach. Start at the macro level: Design, sell, make, deliver. These steps can be converted into a linear chart (see Figure 1).
It is tempting to start creating flow charts at the micro level first, but be careful. Although it may seem to be a faster and more relevant approach, it can easily become a haphazard collection of unrelated charts that can lead to potentially serious inconsistencies and omissions. This is wasteful effort.
After acquiring approval from top managers that this macro process meets the business objectives, focus on each step and then elaborate. In practical terms, this usually means sitting down with the manager to map the processes for which they are responsible. This again should be high-level.
Some tools are quick-a chart can be created to explain the process, or records can be kept in note form. Take the following steps:
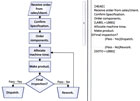
Receive order from sales or client.
Confirm specification.
Order components.
Allocate machine time.
Make product.
Final inspection. Rework if needed.
Dispatch.
These notes can be automatically converted to another linear chart (see Figure 2).
This is the second layer of activity under the ‘make’ step in the initial chart.
Making the changes as the staff discusses will often provide a lot more detail about the real process, some of it often unexpected.
There are four key outcomes from this process:
Staff will have found great ways to work efficiently around inefficient processes.
Staff gets an early warning of unacceptable shortcuts and previously unidentified risks.
Everyone feels they are part of the process and owns a piece of it.
Increased engagement leads to improvements in all areas: quality, efficiency and customer delight.
After the processes are produced for all the layers of the business, the bottom layer will provide a task-by-task operational instruction flow chart, allowing staff to carry out the most tasks, or at least have a detailed understanding of how such tasks should be done.
A good flow chart is:
Fast to produce and amend.
Capable of connecting steps to more detail or data, other documents, applications and Web services.
Easy to understand and walk through logically.
Having created this hierarchy of processes, it is important to have a mechanism of change control, signoff by managers and an archive of past versions. Being able to trace back to a process in operation at the time of nonconformances makes investigation much easier. Some systems also have the ability to analyze and simulate a process activity in simple terms, but flowcharting software that provides for these analysis are ideal for moving toward Six Sigma.
Figure 1: Start at the macro level by converting basic steps into a linear chart. Source: Proquis Inc.
In the world of business, we all need to know what the sum of our efforts ultimately leads to. If we fail to understand this, our mental lives will be poorer, the results of our efforts will be substandard, and we will be inefficient operators-regardless of the very welcome pay check. Quality, along with profits, will most certainly suffer.
Meetings are no substitute for progress; however, knowledge-which springs from communication-is the key to achievement. We are all managers, as well as workers. Many of us are limited to managing how we use our own time; others manage and shape the way our whole business operates. The difference is in the detail of what information is needed to do the job and what one must impart to allow others to do theirs. The resulting knowledge base is the bedrock every company needs to prosper.
If the business is to succeed, one must ensure that access to this knowledge is fast, simple, current and relevant.
With this in mind, a flow chart is a great communication method. It is easy to interpret and it can be viewed by those who need it whenever they want. Developed in the right way-with good tools and in the right hands-flow charts will deliver much more than an illustration of the process. The flow chart should deliver instant knowledge relevant to what needs to be done at that moment, with complete reliability.
Figure 2: The second layer of the chart begins at the ‘make’ step. Source: Proquis Inc.
Three Basic Steps
A flow chart is a graphic representation of the successive steps in a process, procedure or system. It uses symbols interconnected with lines to illustrate three basic steps: input, operation and outcome.Mapping a process is actually quite simple, if done with the right tools. To make flow charts truly useful, create them with a systematic approach. Start at the macro level: Design, sell, make, deliver. These steps can be converted into a linear chart (see Figure 1).
It is tempting to start creating flow charts at the micro level first, but be careful. Although it may seem to be a faster and more relevant approach, it can easily become a haphazard collection of unrelated charts that can lead to potentially serious inconsistencies and omissions. This is wasteful effort.
After acquiring approval from top managers that this macro process meets the business objectives, focus on each step and then elaborate. In practical terms, this usually means sitting down with the manager to map the processes for which they are responsible. This again should be high-level.
Some tools are quick-a chart can be created to explain the process, or records can be kept in note form. Take the following steps:
These notes can be automatically converted to another linear chart (see Figure 2).
This is the second layer of activity under the ‘make’ step in the initial chart.
Key outcomes
One then repeats the activity, expanding each step by observing and talking to the people who carry out the work. One approach is observing and making simple notes, then bringing them into a room and showing others the first draft. If the changes can be quickly displayed and made while others talk-as some tools are adapted to do-the review of the chart is fast.Making the changes as the staff discusses will often provide a lot more detail about the real process, some of it often unexpected.
There are four key outcomes from this process:
Staff will have found great ways to work efficiently around inefficient processes.
Staff gets an early warning of unacceptable shortcuts and previously unidentified risks.
Everyone feels they are part of the process and owns a piece of it.
Increased engagement leads to improvements in all areas: quality, efficiency and customer delight.
After the processes are produced for all the layers of the business, the bottom layer will provide a task-by-task operational instruction flow chart, allowing staff to carry out the most tasks, or at least have a detailed understanding of how such tasks should be done.
A good flow chart is:
Having created this hierarchy of processes, it is important to have a mechanism of change control, signoff by managers and an archive of past versions. Being able to trace back to a process in operation at the time of nonconformances makes investigation much easier. Some systems also have the ability to analyze and simulate a process activity in simple terms, but flowcharting software that provides for these analysis are ideal for moving toward Six Sigma.
Looking for a reprint of this article?
From high-res PDFs to custom plaques, order your copy today!


