Brain Teasers: Corner Thickness Challenges
Anyone who has faced a production problem with a need to solve the problem by using production data can relate to the notion of a brain teaser. The brain teasers presented here are based on real-world situations that are encountered by workers in manufacturing environments. The brain teasers have three parts: (1) the situation, (2) available data or other supporting information and (3) questions that various workers want answered for continual improvement. Recommended solutions follow in the next issue and on the Web at Quality Online (www.qualitymag.com).
Situation
Ian is an engineer for a company that produces heavy-duty plastic molded containers for home and industrial use. All of these containers are subject to rigid testing to meet safety specifications by outside organizations. For one particular product, 2-GAP-HD, there have been problems meeting the minimum thickness for the corners without adding weight to the container. Every extra gram increases the cost of production. Currently, Ian is adding an average of 50 grams of extra weight to meet the minimum corner thickness specification of
3 millimeters.
After a product cost meeting, Ian was assigned to reduce the weight of the 2-GAP-HD and still meet the minimum corner thickness specification. Ian's first step was to collect data on the 2-GAP-HD production units.
Available data
Current practice has been to test three containers twice a shift and record the minimum corner thickness out of the container's eight corners. Ian set up a data collection plan to record the thickness of all eight corners on three containers every two hours. Data for one day are given in the table, "Corner Thickness Values for 2-GAP-HD."

Questions
1. Ian analyzed the data using all eight values for a single unit as a subgroup. He had a total of 24 subgroups on an average and range chart. With this approach, what is the behavior of corner thickness for product 2-GAP-HD?
2. Is corner thickness meeting the minimum specification?
3. As the process currently behaves, is there a chance that a unit will have a corner that is below the minimum specification?
4. How can Ian use these data to learn a way to reduce weight and still meet the minimum corner specification?
Answers to February Brain Teaser
Grant received a complaint from a customer that the specifications for his product are no longer being met. Previous to the complaints, the sales manager for this product had signed a contract with a new customer agreeing to tighter specifications. Because the production process could not meet the tighter specifications with every product, a sorting process was initiated so that the product that met the tighter specification would be sent to the new customer. Now Grant has to deal with the long-time customers and figure out a way to address their complaints.
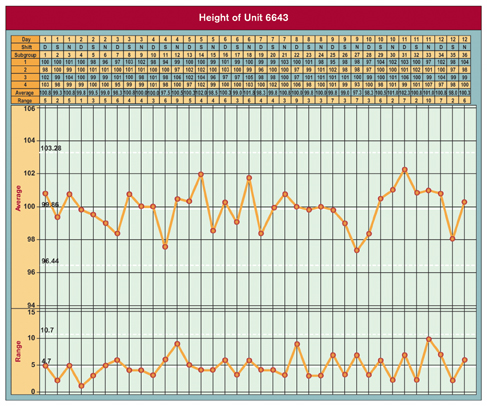
Q: What is the behavior of the production process for the height of Unit 6643?
A: Based on the data provided, the behavior of height of Unit 6643 after the production process is predictable with an average of 99.86 and an average range of 4.69. This is shown in the average and range chart, "Height of Unit 6643." This behavior leads to natural process limits of 93.02 to 106.7. The height values are almost exactly in the center of the specifications and well within the original specification limits.
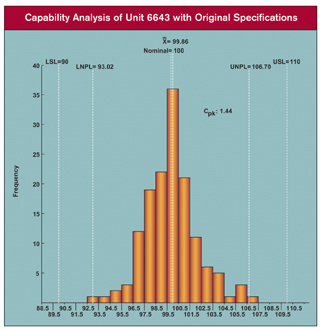
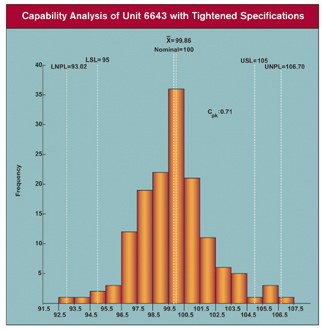
Q: What is the Cpk value for height using the original specifications? Using the tightened specifications?
A: The Cpk value for height using the original specifications is 1.44 as shown in the graph, "Capability Analysis of Unit 6643 with Original Specifications." With the tightened specifications, the Cpk is 0.71 as shown in the graph, "Capability Analysis of Unit 6643 with Tightened Specifications."
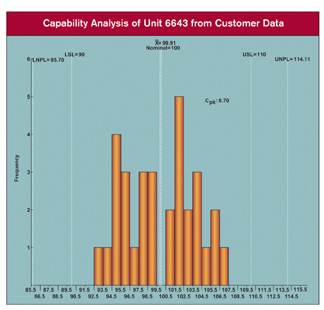
Q: Why does the customer's process behavior chart show an increase in the standard deviation for height?
A: The standard deviation for height is based on the average range. Original customers are now getting fewer units between 95 and 105 because the new customer is only getting units between 95 and 105 after the sorting operation. The resulting distribution of heights of units sent to the original customers is flatter than the distribution of heights for units just off the process. The flatter distribution contributes to larger ranges and therefore a larger standard deviation. This happens even though no units fall outside the original specifications. Also, the larger standard deviation gives a Cpk of 0.7, which leads the original customers to believe they will get units that do not meet specification. See the graph, "Capability Analysis of Unit 6643 from Customer Data."
Q: What can Grant do about the situation?
A: A meeting with the sales manager is a top priority for Grant. They need to develop guidelines about what is promised to new customers. Next, Grant needs to have a conversation with the original customers showing them what the process is producing and why the Cpk they calculate suggests that they will get units that do not meet specifications.
Looking for a reprint of this article?
From high-res PDFs to custom plaques, order your copy today!


