Brain Teasers: Improvement Challenges
Congratulations to Bob Fischnich, manager, corporate compliance and quality development at The Schnipke Engraving Co. Inc. (Ottoville, OH) on solving the final Brain Teaser and winning the Kindle.
Anyone who has faced a production problem with a need to solve it by using production data can relate to the notion of a brain teaser. The brain teasers presented here are based on real-world situations en-countered by workers in manufacturing environments. The brain teasers have three parts: (1) the situa-tion, (2) available data or other supporting information and (3) questions that various workers need answered for continual improvement. Recommended solutions follow in the next issue.
According to capability analyses conducted prior to full production, the outside diameter had a Cpk of 1.4. However, this Cpk has never been realized in full production because, until recently, the first pass yield has averaged just below 99.5%. The specifications for outside diameter are 2 inches ±0.004 inch. Myra and Tracy held a meeting with the supervisors and operators in component machining to discuss the decrease in first pass yield and determine why the impeller is failing on outside diameter. During this meeting they were informed that the actual values for outside diameter were shown on the display for the measuring instrument but not recorded in the computer. Only the first pass yield is avail-able for analysis.
2. What is the process behavior of the outside diameter for these impellers for the time period provided?
3. Does the process behavior for the outside diameter help explain the decrease in first pass yield?
4. What specific actions need to be taken based on the process behavior of the outside diameter of these impellers to improve first pass yield?
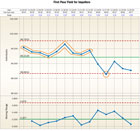
A: An analysis of the first pass yield data using an individuals and moving range chart reveals a long run of nine points at the beginning of the chart and a single value below the lower natural process limit for November 17. These signals taken together indicate that the first pass yield was higher from No-vember 2-12 and then decreased for November 16-20. See the graph, “First Pass Yield for Impellers.”
 Q: What is the process behavior of the outside diameter for these impellers for the time period pro-vided?
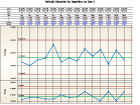
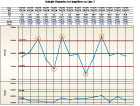
A: Process behavior is determined by analyzing the data on a process behavior chart (also known as a control chart). Each line is a separate process; therefore, two process behavior charts are needed. Every hour two impellers were selected from each line to record the outside diameter. The analysis for each line is conducted using an average and range chart with a subgroup of size 2. For Line 1 the outside di-ameter of the impellers is predictable (in statistical control) with an average of 1.999329 and a standard deviation of 0.001266. The chart for Line 2 shows that the outside diameter of the impellers is unpre-dictable. The average is 1.999921 with a standard deviation of 0.000937. These values cannot be used reliably because of the signals of exceptional variation on the average chart. There are three average values above the upper control limit and two average values below the lower control limit. See the av-erage and range charts, “Outside Diameter for Impellers on Line 1” and “Outside Diameter for Impel-lers on Line 2.”
 Q: Does the process behavior for the outside diameter help explain the decrease in first pass yield?
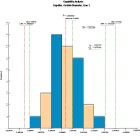
A: Yes, the process behavior does help explain the decrease in first pass yield, but for different reasons for each of the two lines. The capability analysis for Line 1 gives a Cp of 1.05 with a Cpk of 0.876. With a Cpk of 0.876 and an average that is about a half a standard deviation below the target value, there will likely be impellers that do not meet the specifications. Even though the data currently available have no values outside specification, the lower natural process limit is outside the lower specification limit of 1.996. See the graph, “Capability Analysis of Outside Diameter of Impellers, Line 1.”
 For Line 2 the presence of exceptional variation in the outside diameters of impellers could lead to impellers that do not meet specifications even though the current data values are all inside the speci-fications. Allowing one or more exceptional causes of variation to persist is not beneficial from either a quality or economic perspective. If capability indexes are required, Pp = 0.763 and Ppk = 0.748 can be used. However, these values are not reliable for future results from Line 2 because the average and standard deviation were not calculated from predictable process behavior. Furthermore, the Pp and Ppk are both less than 1.0 and indicate that Line 2 is likely not to meet the specifications if the current un-predictable behavior continues.
Q: What specific actions need to be taken based on the process behavior of the outside diameter of these impellers to improve first pass yield?
A: Line 1: Actions need to be directed to moving the average closer to the target of 2.000 and reducing the variation. Moving the target will only help to get Cpk equal to Cp which is 1.053. Further improve-ments require a reduction in the variation. The current standard deviation is 0.001266. Reducing varia-tion is often a challenge and techniques, such as Designed Experiments are required to determine what causes the large variation. After the impact of various causes of variation are discovered using designed experiments, one or more of these causes must be changed. This is what is known as fundamental change to the process.
Line 2: Actions need to be directed to finding the causes of the exceptional variation and elimi-nating these causes from the process. Such actions could lead to a process that is predictable with a Cpk of 1.39.
Six Sigma and Lean Six Sigma training for Champions, Black Belts and Green Belts, offered by Dr. Ward and her associates at Pinnacle Partners Inc. For more information, call (865) 482-1362 or visit www.pinnaclepartnersinc.com.
Anyone who has faced a production problem with a need to solve it by using production data can relate to the notion of a brain teaser. The brain teasers presented here are based on real-world situations en-countered by workers in manufacturing environments. The brain teasers have three parts: (1) the situa-tion, (2) available data or other supporting information and (3) questions that various workers need answered for continual improvement. Recommended solutions follow in the next issue.
Situation
Myra and Tracy are process engineers in the component machining area of a company that manufac-tures medical devices for hospitals, clinics and doctors’ offices. One specialty product is a pump that is widely used in these areas. In the past week, the first pass yield for the outside diameter of an impeller in the pumps has decreased enough to be noticed by Henry, the production manager. Henry then sent an e-mail to Myra and Tracy to determine what is going on with these impellers.According to capability analyses conducted prior to full production, the outside diameter had a Cpk of 1.4. However, this Cpk has never been realized in full production because, until recently, the first pass yield has averaged just below 99.5%. The specifications for outside diameter are 2 inches ±0.004 inch. Myra and Tracy held a meeting with the supervisors and operators in component machining to discuss the decrease in first pass yield and determine why the impeller is failing on outside diameter. During this meeting they were informed that the actual values for outside diameter were shown on the display for the measuring instrument but not recorded in the computer. Only the first pass yield is avail-able for analysis.
Available Data
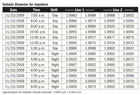
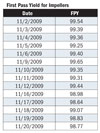
Myra and Tracy enlisted the assistance of one of the plant computer technicians to capture the actual outside diameter of each impeller that was measured. There are two lines that machine these impellers and every hour two impellers are diverted to a measurement station. The outside diameters for both im-pellers for each line are summarized in the table, “Outside Diameter for Impellers.” Also, data for first pass yield is provided in the table, “First Pass Yield for Impellers.”Questions
1. Based on the first pass yield available for November, is there evidence to support Henry’s observa-tions that first pass yield has decreased? Provide compelling analysis to support your answer.2. What is the process behavior of the outside diameter for these impellers for the time period provided?
3. Does the process behavior for the outside diameter help explain the decrease in first pass yield?
4. What specific actions need to be taken based on the process behavior of the outside diameter of these impellers to improve first pass yield?
Answers to December Brain Teaser
Q: Based on the first pass yield available for November, is there evidence to support Henry’s observa-tions that first pass yield has decreased? Provide compelling analysis to support your answer.A: An analysis of the first pass yield data using an individuals and moving range chart reveals a long run of nine points at the beginning of the chart and a single value below the lower natural process limit for November 17. These signals taken together indicate that the first pass yield was higher from No-vember 2-12 and then decreased for November 16-20. See the graph, “First Pass Yield for Impellers.”
A: Process behavior is determined by analyzing the data on a process behavior chart (also known as a control chart). Each line is a separate process; therefore, two process behavior charts are needed. Every hour two impellers were selected from each line to record the outside diameter. The analysis for each line is conducted using an average and range chart with a subgroup of size 2. For Line 1 the outside di-ameter of the impellers is predictable (in statistical control) with an average of 1.999329 and a standard deviation of 0.001266. The chart for Line 2 shows that the outside diameter of the impellers is unpre-dictable. The average is 1.999921 with a standard deviation of 0.000937. These values cannot be used reliably because of the signals of exceptional variation on the average chart. There are three average values above the upper control limit and two average values below the lower control limit. See the av-erage and range charts, “Outside Diameter for Impellers on Line 1” and “Outside Diameter for Impel-lers on Line 2.”
A: Yes, the process behavior does help explain the decrease in first pass yield, but for different reasons for each of the two lines. The capability analysis for Line 1 gives a Cp of 1.05 with a Cpk of 0.876. With a Cpk of 0.876 and an average that is about a half a standard deviation below the target value, there will likely be impellers that do not meet the specifications. Even though the data currently available have no values outside specification, the lower natural process limit is outside the lower specification limit of 1.996. See the graph, “Capability Analysis of Outside Diameter of Impellers, Line 1.”
Q: What specific actions need to be taken based on the process behavior of the outside diameter of these impellers to improve first pass yield?
A: Line 1: Actions need to be directed to moving the average closer to the target of 2.000 and reducing the variation. Moving the target will only help to get Cpk equal to Cp which is 1.053. Further improve-ments require a reduction in the variation. The current standard deviation is 0.001266. Reducing varia-tion is often a challenge and techniques, such as Designed Experiments are required to determine what causes the large variation. After the impact of various causes of variation are discovered using designed experiments, one or more of these causes must be changed. This is what is known as fundamental change to the process.
Line 2: Actions need to be directed to finding the causes of the exceptional variation and elimi-nating these causes from the process. Such actions could lead to a process that is predictable with a Cpk of 1.39.
Six Sigma and Lean Six Sigma training for Champions, Black Belts and Green Belts, offered by Dr. Ward and her associates at Pinnacle Partners Inc. For more information, call (865) 482-1362 or visit www.pinnaclepartnersinc.com.
Looking for a reprint of this article?
From high-res PDFs to custom plaques, order your copy today!


