Brain Teasers: In-process Weighing
Anyone who has faced a production problem with a need to solve the problem by using production data can relate to the notion of a brain teaser. The brain teasers presented here are based on real-world situations that are encountered by workers in manufacturing environments. The brain teasers have three parts: (1) the situation, (2) available data or other supporting information and (3) questions that various workers want answered for continual improvement. Recommended solutions follow in the next issue and on the Web at Quality Online (www.qualitymag.com).
Situation
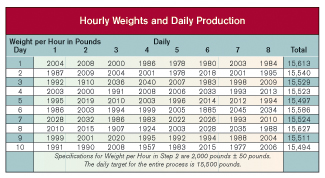
Curtis works as the production supervisor in a cereal manufacturing plant. In Step 2 of a five-step process, large volumes of product are conveyed through a tunnel where moisture is added. The cereal then passes over a weight belt where hourly weights are recorded. These weights, as well as the total production for the whole process, are summarized in the daily production report. Sometimes Step 2 slows down and the weight-per-hour values are low. In order to achieve the daily goal for Step 2, Curtis feels pressure to increase the line speed to compensate for the slowdown.
Unfortunately, both slowing down and speeding up the line cause problems elsewhere in the process. Also, after a slowdown, increasing the speed beyond its capacity in this step does not impact daily production goals because other steps in the process cannot adjust to the higher speeds. Increased speed can create losses throughout steps 3, 4 and 5. At the most recent production meeting, Curtis tried to explain this concept, but most of the people at the meeting did not understand his explanation.
Available data
Curtis reviewed daily production reports for the past 10 workdays. He summarized the weight-per-hour values as well as total production for each of the 10 days. Only one shift was operating during this time. These data values are given in the table, "Hourly Weights and Daily Production."
Questions
1. If the hourly goal for Step 2 is 2,000 pounds, why is the daily goal for the entire process only 15,500 pounds?
2. Do the hourly data appear to say that an effort is being made to speed up Step 2 of the process after a slowdown?
3. Is Step 2 operating in a predictable manner?
4. Do the slow periods and the speed ups make a difference in meeting the goal for the day? Hint: Make a scatter plot of the data.
Answers to November Brain Teaser
Slot width is a critical dimension on a part that will be used by a customer in a complex component. In machining the slot width, the part goes through a rough cut and a final cut. Each cut can be performed at any of three workstations. Currently, the slot width has a sigma level of 4.9. The customer has just tightened the specifications and simultaneously set the sigma level at 6. Everyone in production and quality believe there is no more opportunity for improvement and that they will lose the contract for this part.
Q: What is the behavior of slot width on the finished parts?
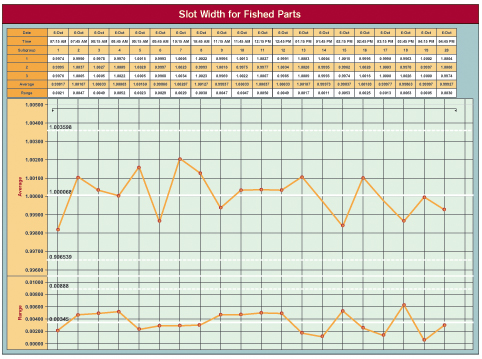
A: Using the data from Oct. 6, the process is operating predictably with an average of 1 inch and an average range of 0.00345. See the graph, "Slot Width for Finished Parts."
Q: Based on the Oct. 6 data, how can it be verified that the slot width has achieved a sigma level of 4.9?
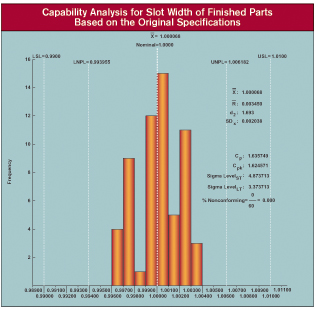
A: Under the original specifications of 1 ± 0.01 inch, the process for making the slot width gave results that achieved a Cpk of 1.6246 as shown in the graph, "Capability Analysis for Slot Width of Finished Parts Based on the Original Specifications." This equates to a sigma level of 4.87 which rounds to 4.9.
Q: What can be learned by analyzing the data from the three machines that make the final cut?
A: The data from the three final-cut machines can be analyzed to show if they are all working the same. All three final-cut machines behave predictably, but the averages for the three machines are different. A review of the three separate capability analyses shows that Machine A values are essentially centered within the specifications with a sigma level of 4.3. Machine B values are all greater than the target of 1 inch, while all of the Machine C values are below this target. The current sigma levels for Machine B and C are 5.43 and 2.93, respectively.
Q: What can production do to meet the new specifications?
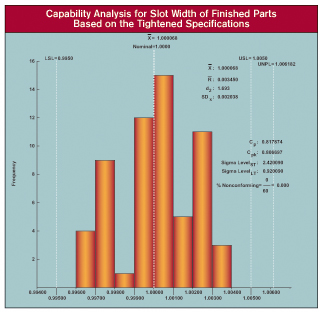
A: If production can set all three final-cut machines at the target, the total variation in the finished parts will be reduced. This would improve the sigma levels of Machines B and C to 8.4 and 5.4, respectively. This is the first approach to meeting the new specifications and can improve the sigma level of the finished parts even with the tightened specifications. The second approach will be to reduce the variation within each of the three final-cut machines.
Looking for a reprint of this article?
From high-res PDFs to custom plaques, order your copy today!


