The Cost of a Poor Measurement System
Convince people of the value of measurement system analysis.
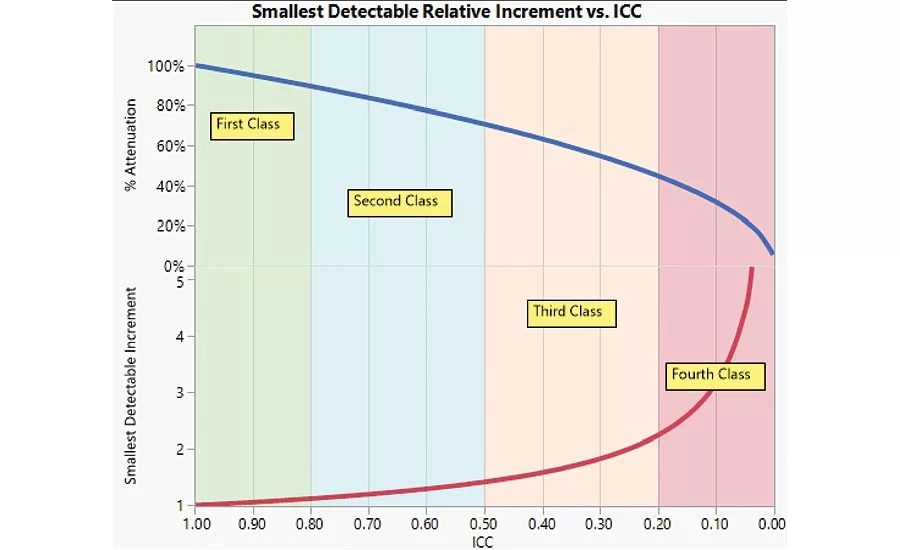
Figure 1: Measurement System Quality (ICC) vs. Attenuation.
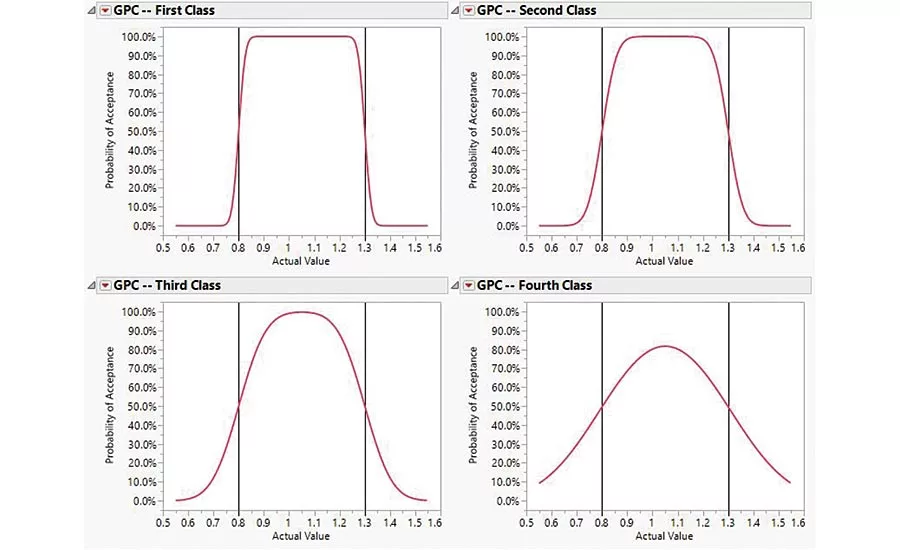
Figure 2: Measurement System Quality vs. Gage Performance. The red curve is the probability of accepting a part as in specification. The vertical black lines are the specification limits.
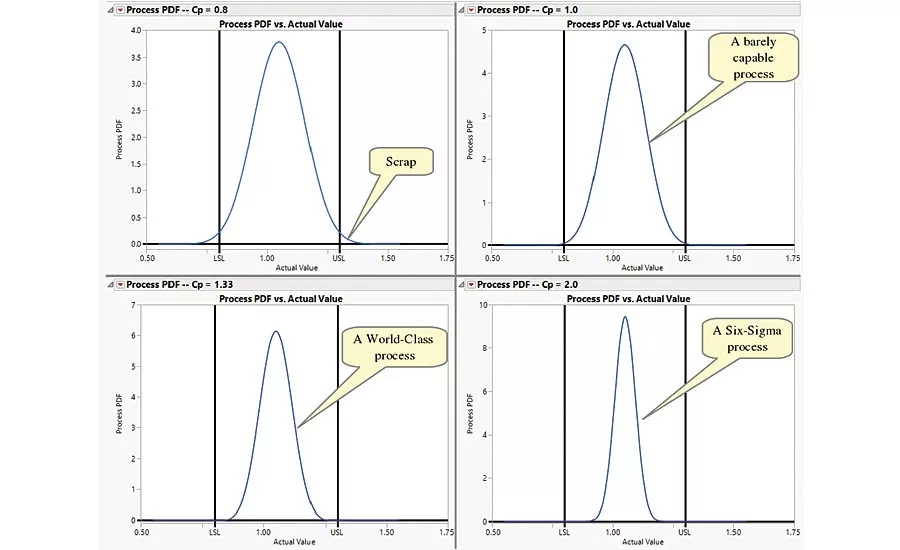
Figure 3: Process Quality (CP)
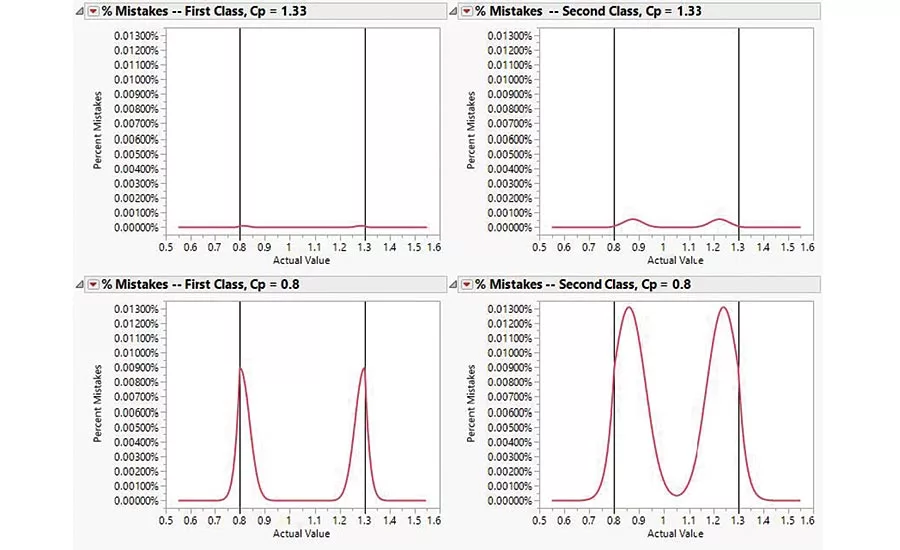
Figure 4: Mistakes due to measurement system quality—accepting bad product and rejecting good product—for an excellent process and a poor process. Notice that most of the mistakes are rejecting good product.
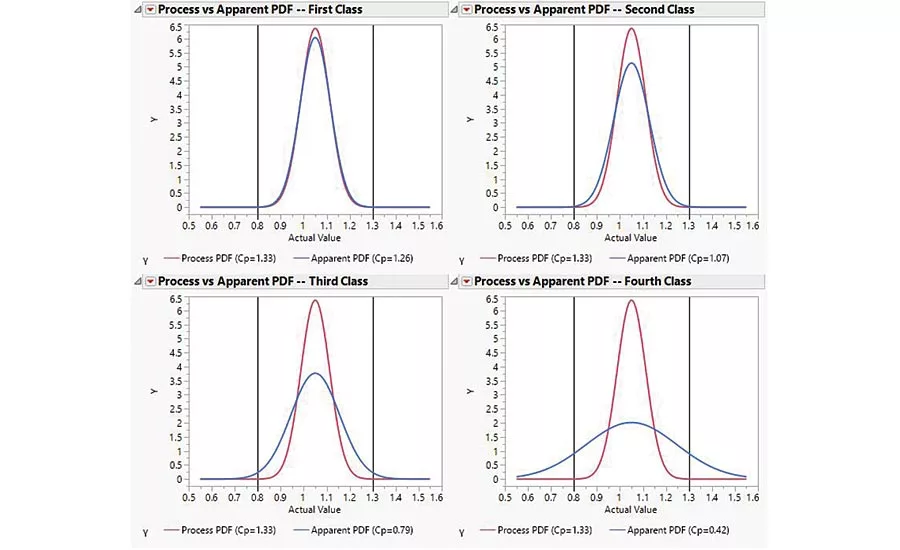
Figure 5: The importance of using a good measurement system to determine process performance. The red lines represent the true process performance. The blue lines represent the apparent process performance due to measurement error.
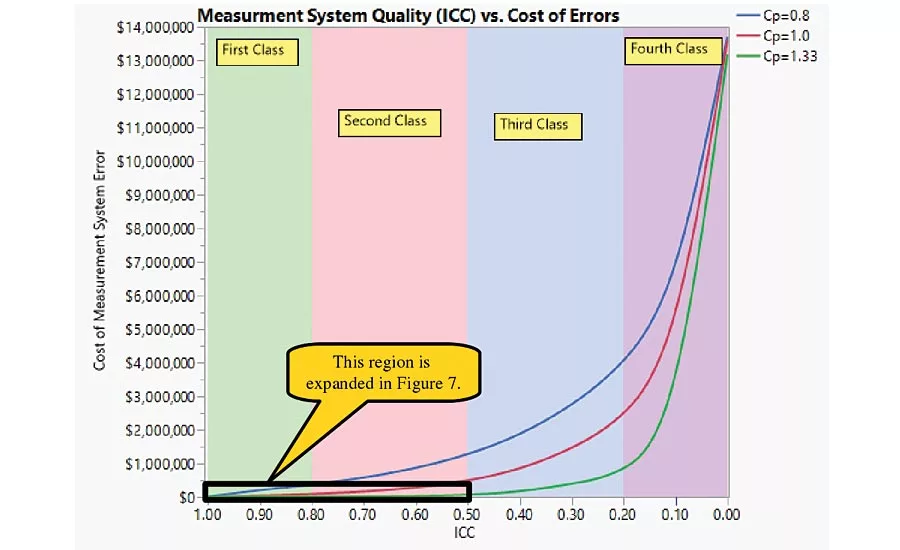
Figure 6: The cost of measurement error. This plot shows the cost of rejecting good product for different process qualities (CP) with different gage qualities (ICC). This example uses 10,000,000 parts produced per year and sold for $1.50 each.
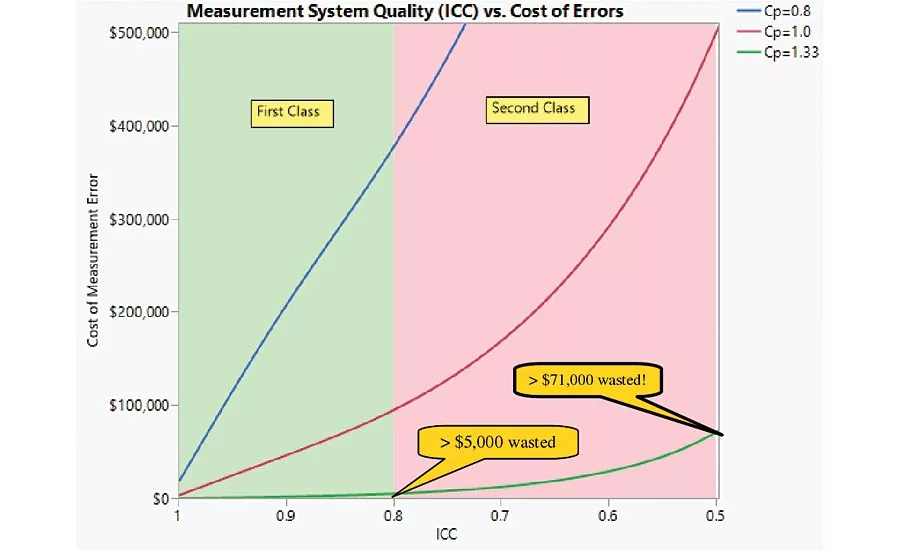
Figure 7: The cost of measurement error for good gages. This plot shows the cost of rejecting good product for different process qualities (CP) with different gage qualities (ICC). This example uses 10,000,000 parts produced per year and sold for $1.50 each.
Quality professionals know the value of good measurement systems. They know that without trustworthy, high quality data you cannot make good business decisions. Unfortunately, most business people and many engineers don’t understand this value. Convincing them to spend time and money on a measurement system analysis can be a very difficult task. My goal here is to provide information to help you more easily convince engineers and business people of the value of measurement system analysis.
It all starts with noise. Noise is that characteristic of nature that causes measurements of the same item, by the same person, with the same gage to vary. Noise comes from various sources, but we are currently interested in the noise that comes from our measurement systems. Every measurement system is affected by some noise—the question is, how much? Only a measurement system analysis can answer this.
What we really want to measure—the thickness of a tire tread or the weight of a candy bar—is the signal. If the signal is large relative to the noise, we have a good measurement system. If the noise is large relative to the signal, we have a poor measurement system.
Here’s an analogy: you are driving along on a Great American Family Vacation listening to AM radio. The signal from the station is coming in loud and clear—there is very little noise. This is a first class measurement system. As you approach some high tension power lines you begin to hear some noise. You can still hear the signal, but the noise is getting annoying. This is a second class measurement system. As you get even closer to the lines it becomes difficult to hear all the words so you aren’t certain what is being said. This is a third class measurement system. As you pass directly beneath the power lines the noise becomes so loud you can’t really hear the station. This is a fourth class measurement system.
As you passed beneath the power lines the noise “attenuated” the signal. The signal was equally strong, but the noise obscured it. Noise in a measurement system acts the same way—as it becomes large relative to the signal, it attenuates the signal. Figure 1 is a graph of measurement system quality vs. attenuation. The measurement system quality is measured by the Intraclass Correlation Coefficient, or ICC for short. The ICC is the proportion of the variation in a data set that is due to parts really varying. One minus the ICC (1-ICC) is the proportion of the variation due to measurement system noise. So, as the ICC decreases, the attenuation increases. In fact, a poor measurement system can only measure 20% of the signal that a perfect measurement system could measure, requiring a signal five times larger to detect it.
Donald Wheeler used the ICC to specify four classes of measurement system—first, second, third, and fourth—in his book, “EMP III: Evaluating the Measurement Process” (SPC Press). A fourth class measurement system is not useful. First, second, and third class measurement systems may be useful depending on the application.
One application is detecting differences. If you are developing a product or process, the only way you can tell if you’ve made an improvement is by detecting differences. Suppose your company wants to improve their candy bar recipe. You rate the taste on a scale from 1 to 10, with 10 being delicious. Maybe you’ve managed to rate a 7 with your current recipe. If your new recipe rates an 8 you’ve made improvement—if the difference you’ve measured is real and not due to noise. A second class measurement system requires 50% more data than a first class measurement system to be confident in the difference. A third class measurement system requires three times as much data. A fourth class measurement system requires at least 10 times as much data.
You can communicate the need to know the measurement system quality for detecting differences by pointing out that R&D must collect data to make decisions. If your measurement systems aren’t good enough, R&D could be doing 10 times the necessary work because of a poor tool.
Another application is control charting. Control charts help you detect changes in a process early so you can take action before a crisis arises. If you have a first class measurement system, you have an excellent chance of detecting a difference by simply watching for points that fall outside the control limits. If you have a second class system, you will need to add three more rules to do as well. With a third class measurement system your chance of detecting the difference early will be less even with all four tests. A fourth class measurement system will make it very difficult or impossible to tell if your process is changing.
You can communicate the need for a measurement system analysis for control charting by pointing out the risk in failing to detect a process change in time to prevent producing scrap.
One more application is deciding whether to accept or reject product. The first thing to consider in this application is the ability of your measurement system to identify correctly whether a part is in specification. Gage performance curves are a great visual tool for this evaluation. Figure 2 has gage performance curves for each of the measurement system classes. Notice that as the class decreases, the chance of making mistakes increases. With a fourth class measurement system you never have better than an 80% chance of accepting any product!
The gage performance curve is only half the story. If you have an excellent process, you can get away with a lower class measurement system. If you have a marginal process, you will need a first class measurement system. To understand this we need a measure of process quality. CP measures the quality of your process. A CP less than one will produce scrap on a regular basis. A process with a CP of one will produce little scrap if it is running perfectly. A process with a CP of 1.33 will produce little scrap even if it isn’t running at its peak. Figure 3 shows what you can expect from each of these processes.
Combining gage performance with process quality allows us to see the whole picture. For instance, if CP is 0.8, mistakes are very critical near the specification limits—we could accept out of specification product or reject in specification product—so we need a first class measurement system. For CP = 1.33, mistakes near the specification limits are less critical—we produce almost nothing near the specification limits to be mistaken about! Figure 4 shows the consequences of mistakes due to measurement system quality for different quality processes. Notice that the majority of the mistakes will be scrapping good product.
One complication is that we can only make curves like those in Figure 3 by making measurements. If our measurement system is good, the curves will accurately predict what our process does. If the measurement system is poor, the curve will not predict our process behavior well. Figure 5 illustrates this. Notice that even a first class measurement system slightly underestimates the true process quality. If you determine CP with a poor quality gage you may believe your process needs improvement when it doesn’t.
You can convince people of the need for a measurement system analysis for accepting or rejecting product by pointing out the increased chances for accepting bad product and rejecting good product.
This information will convince many people of the need for a measurement system analysis. However, those who think in terms of dollars and cents may still not be convinced. Measurement errors are costing your company money. Unfortunately, it often requires more financial information than is readily available to calculate the cost. The good news is there is one situation where it is easy to find the financial information to estimate the cost of measurement error—rejecting good product. You only need to know the revenue for an item you produce and the number of items you produce in one year.
The revenue for an item is the amount you sell it for. This includes the cost to manufacture the item and the profit. Whenever you reject a good item you lose this entire revenue. You need to know the number of items produced in one year to estimate the number of good items you will reject. If you know the proportion of good items rejected, you can estimate the cost. The calculations are very tedious. I wrote an Add-In for the software JMP to help me. (You can get a copy of this Add-In for free at https://community.jmp.com/docs/DOC-7529).
Figures 6 and 7 show the results of several calculations for a company producing ten million items that sell for $1.50 each. Process quality is the biggest factor for reducing the cost of unnecessary scrap—the better the process, the less money wasted. However, even if you have a world class process—CP = 1.33—you need at least a second class measurement system to avoid wasting significant amounts of money.
The real point of a measurement system analysis is to know if your measurement system is good enough for your application. If it isn’t good enough, you can work to improve it.
A common objection is, “We paid a lot of money for this instrument. Why do we have to test it?” Unfortunately, price is no guarantee. While the instrument may perform exceptionally in some applications, it may not perform so well in yours. The only way to know is to test it.
This information can help you more easily convince engineers and business people to spend the necessary time and money on a measurement system analysis. This will lead to superior business decisions. With your help, they may even consider measurement system analysis a good value for their dollar.
Looking for a reprint of this article?
From high-res PDFs to custom plaques, order your copy today!


