Gage R&R (Repeatability and Reproducibility)
Measurement system analysis can help you improve the quality of your products.

Gage R&R: Measurement system analysis can help you improve the quality of your products.
When I first got involved with quality, I learned about the “five M’s” that constituted most root causes: man, machine, materials, methods, and measurement. In manufacturing you know that measurement gages and how they are used can be a key cause of variation.
Measurement Systems Analysis (MSA)
MSA is actually quite simple, but even seasoned SPC veterans don’t seem to understand it. So I thought I’d simplify it for you.
First, Gage R&R studies are usually performed on variable data: height, length, width, diameter, weight, viscosity, etc.
Second, when you measure, three factors come into play:
- Part variation (differences between individual pieces manufactured)
- Appraiser variation (aka reproducibility) - Can two different people get the same measurement using the same gage?
- Equipment variation (aka repeatability) - Can the same person get the same measurement using the same gage on the same part in two or more trials?
You want most of the variation to be between the parts and less than 10% of the variation to be caused by the appraisers and equipment. Makes sense, doesn’t it? If the appraiser can’t get the same measurement twice or two appraisers can’t get the same measurement, then your measurement system becomes a key source of error.
Conducting a Gage R&R Study
To conduct a Gage R&R study, you will need:
- Five to 10 parts (number each part) that span the distance between the upper and lower spec limits. The parts should represent the actual or expected range of process variation. Rule of thumb: if you’re measuring to 0.0001, the range of parts should be 10 times the resolution (e.g., 0.4995 to 0.5005).
- Tar pit: The biggest mistake people make is pulling 10 parts off the production line and trying to do a GR&R. Unfortunately, when this happens, there isn’t enough part variation to get a good GR&R. People often complain: “My parts are good, why is my GR&R so bad?” It’s because they rushed through this first step. You need bad parts to do a good GR&R. How can you tell if you don’t have enough part variation? The number of distinct categories (NDC) is less than five.
- Two (or more) appraisers (people who measure the parts)
- One measurement tool or gage
- A minimum of two measurement trials on each part by each appraiser
- Gage R&R software to analyze the results
Gage R&R
Here is a sample of Gage R&R data from the AIAG Measurement Systems Analysis Third Edition. Note that this data ranges from -1.68 to 2.26. If we plug this data into Gage R&R software, the input form might look like Figure 1.
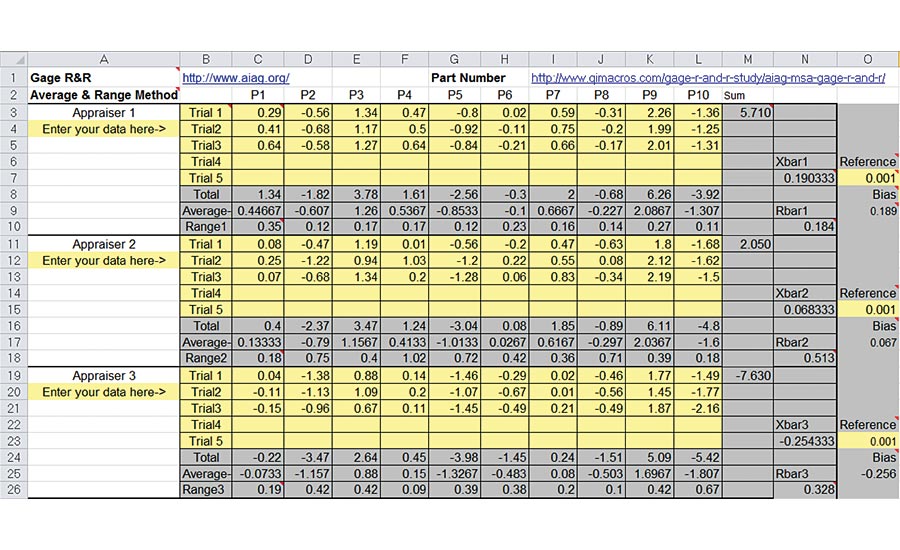
Figure 1.
The results (Figure 2) show that NDC = 5 (the minimum for a good GR&R). Notice that %PV (part variation is large, but so is %R&R. Appraiser variation (%AV) is somewhat larger than equipment variation (%EV). Both could use improvement.
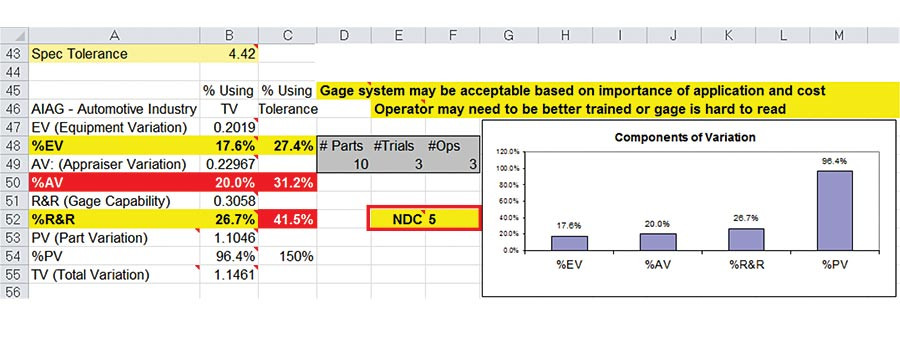
Figure 2.
There are three ways to calculate %R&R:
- Average and Range method (cell B52 = 26.7%) shown in Figure 2.
- Specification Tolerance method (cell C52 = 41.5%) shown in Figure 2 and 3 (cells G70 and M70).
- ANOVA method both with and without interaction (cells E70 = 27.9% and K70 = 30.1%) shown in Figure 3.
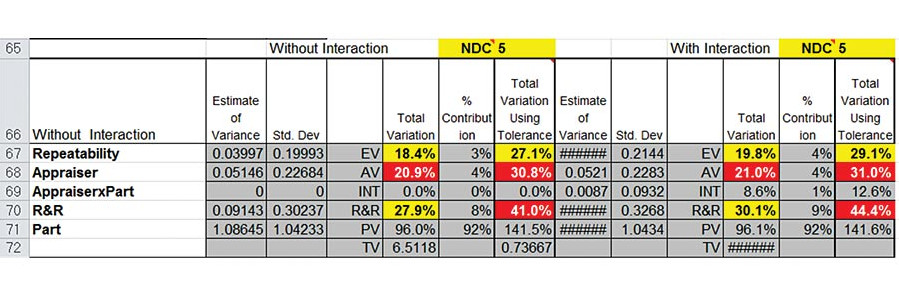
Figure 3.
Gage R&R Requirements
If NDC is less than 5, there is not enough part variation to do a valid Gage R&R. You will need 10 parts that span the specification tolerance to get a good GR&R.
Gage R&R System Acceptability
- %R&R<10% - Gage System Okay (Most variation caused by parts, not people or equipment)
- %R&R<30% - May be acceptable based on importance of application and cost of gage or repair
- %R&R>30% - Gage system needs improvement (People and equipment cause over 1/3 of variation)
What to Look For
Repeatability: Percent Equipment Variation (%EV)
If you simply look at the measurements, can each appraiser get the same result on the same part consistently, or is there too much variation? If repeatability (%EV) is larger than reproducibility (%AV), reasons may include:
- Gage needs maintenance (gages can get corroded)
- Gage needs to be redesigned to be used more accurately
- Clamping of the part or gage, or where it’s measured needs to be improved (imagine measuring a baseball bat at various places along the tapered contour; you’ll get different results.)
- Excessive within-part variation (Imagine a steel rod that’s bigger at one end than the other. If you measure different ends each time, you’ll get widely varying results.)
Reproducibility: Percent Appraiser Variation (% AV)
If reproducibility (%AV) is larger than repeatability (%EV), reasons include:
- Operators need to be better trained in a consistent method for using and reading the gage
- Calibrations on gage are unclear
- Fixture required to help the operator use gage more consistently
If you look at a control chart of appraiser performance, you’ll be able to tell if one person over reads or under reads the measurement (Figure 4). Appraiser 3 consistently measures below appraisers 1 and 2. You can also see that the performance is out of control.
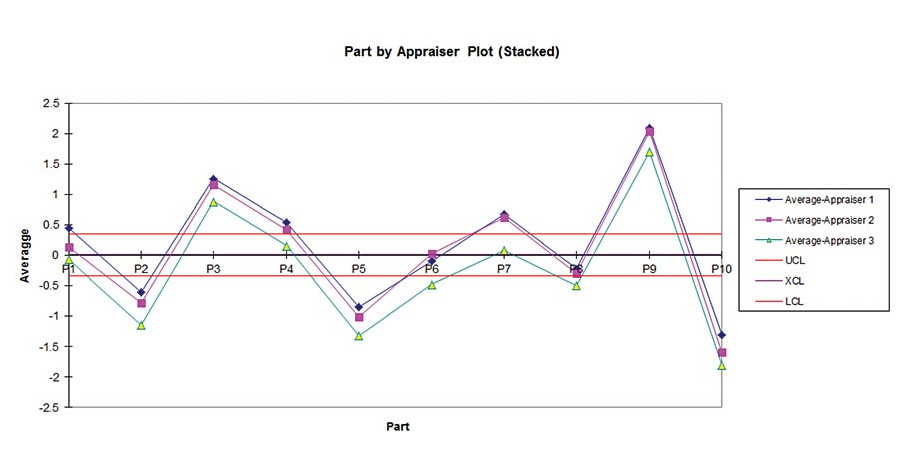
Figure 4.
Mistakes People Make
Many people don’t like the answer using the Gage R&R. Most of the time, it’s because they didn’t follow the instructions for conducting the study. Here are some of the common mistakes:
- Forgetting that the Gage R&R study is evaluating their measurement system and not their products. Gage R&R does not care about how good your products are. It only cares about how good you measure your products.
- Using only one part. If you only use one part, there can’t be any part variation, so people and equipment are the only source of variation.
- Using the one part measurement for all 10 parts (again, there won’t be any part variation, so it all falls on the people and equipment).
- Using a gage that measures in too much detail. If your part is 74mm ±0.05, then you don’t need a gage that measures to a thousandth of an inch (0.001) you need one that measures to the hundredth of an inch (0.01).
Challenges You Will Face
As your process improves and your product approaches the ideal target measurement, you’ll have less part variation and more chance for your measurement system to become the major source of variation. As your product and your process improve, your measurement system will need to improve as well.
Other Forms of Gage R&R
There are other methods of Gage R&R not discussed in this article:
- Attribute Gage R&R which can be used with variable data or pass/fail gages.
- Type 1 Gage R&R which uses one appraiser, one gage and 50 parts.
Conclusion
Your goal is to minimize the amount of variation and error introduced by measurement, so that you can focus on part variation. This, of course, leads you back into the other root causes of variation: people, process, machines, and materials.
If you manufacture anything, measurement system analysis can help you improve the quality of your products, get more business from big customers, and baffle your competition. Enjoy.
Looking for a reprint of this article?
From high-res PDFs to custom plaques, order your copy today!


