Automating Quality in Manufacturing
Automating quality in manufacturing is rarely a one-size-fits-all decision.
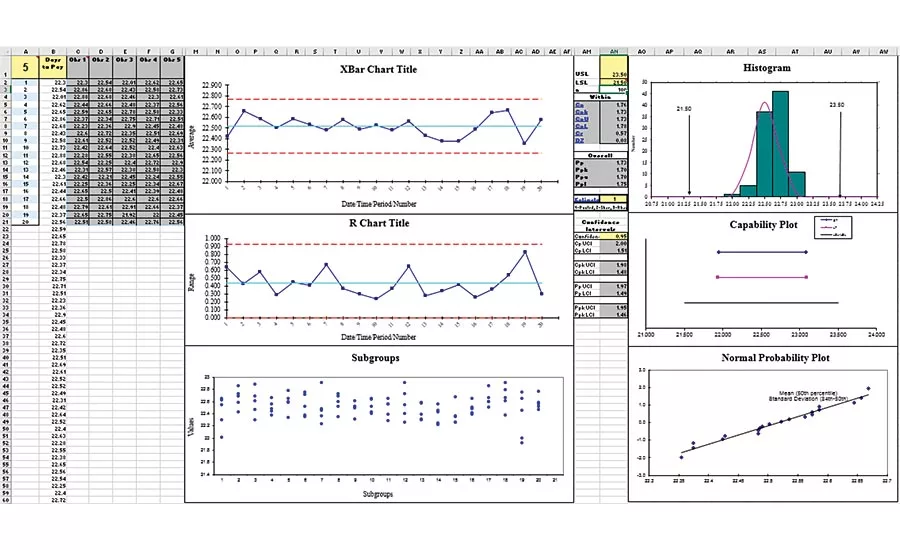
Software choices vary from near real time analysis using Excel SPC templates up to ongoing monitoring using real-time SPC software.
The obvious reasons for automating quality in manufacturing are to reduce scrap, rework, overtime and costs while simultaneously increasing productivity and customer satisfaction. The non-obvious reasons include employee satisfaction, customer referrals and market growth. Automation also give managers and line workers insights into ongoing production. These insights enable employees to be proactive about adjusting production rather than reactive.
When it comes to statistical process control (SPC), capability analysis and quality control, companies often want to take a one-size-fits-all approach to choosing software. Unfortunately, most companies don’t make one widget. They have short runs and longer runs of many different products. Some manufacturers are small and some are huge. I’d like you to consider that a one-size-fits-all approach may work well in your sweet spot, but not so well when you move into other areas of production.
If you have big, high-speed production, you will need more expensive, real-time automated measuring and monitoring equipment to prevent rework and scrap. If you’re making smaller runs of products, you will benefit from less expensive solutions that are a bit more manual but effective nonetheless. Choose software to match your production environment.
Why bother with SPC and capability analysis? The short-term answer is the high cost of poor quality causing rework and scrap. The longer-term answer is the loss of customers and referrals due to poor quality. Almost weekly I hear from a small manufacturing company whose customers are demanding capability analysis, Cp and Cpk measurements greater than 1.66 and statistical process control to confirm ongoing performance. If you aren’t already doing SPC, start integrating it now so that when a customer asks, you can deliver without a crisis.
Twentieth century quality was about manual analysis of performance—calculating control limits and Cp/Cpk by hand and plotting charts manually. Twenty-first century quality is about automation and ultimately integration of all performance data. There is a need for both on-demand SPC and real-time SPC.
Cost of Software
Quality software costs can vary widely.
- Cost of the software itself - $249 (Excel-based) to $1,599 (standalone) to $10,000+ (integrated)
- Cost of training users (varies from minutes online to multi-day training onsite)
- Cost of not using the software because it’s too hard to use (I have spoken to plant managers who purchased very expensive SPC implementations only to find that the workers have reverted to Excel line charts because the selected software is too hard to use.)
- Cost of not using the software because there was no training. Again, if employees find it too hard to use, the benefit will be lost.
- Cost of ongoing maintenance. Some tools have an annual fee while others are licensed for perpetual use.
- Annual license (software as a service)
- Shared licensing (e.g., five users at a time). Unfortunately, shared licenses may prevent access to tools when needed and delay improvements.
- Perpetual license with optional upgrades
Accuracy of SPC Software
Because of the competitive nature of SPC software developers, the outputs from these systems will be identical. Control limits will be identical. A Cp/Cpk from one will be identical to another as long as they are using the same estimator for standard deviation.
One of the common mistakes people make using 20th century Cp/Cpk software is that the calculations are actually used for Pp/Ppk (process performance). Cp/Cpk should use estimators using average range, average standard deviation or pooled standard deviation, not generic standard deviation.
Quality Improvement
Regardless of what quality management system you use, every business can benefit from data mining and analysis. ISO certifications include improvement. Project management certifications include improvement. You will need software to do the analysis, pinpoint the problems and make improvements. Gut feel, trial-and-error and common sense will not take you beyond a 4-sigma, Cp/Cpk of 1.33.
Green belts may not need all of the functionality of a complex software, so they can benefit from an Excel-based toolkit. Many Six Sigma courses do not supply software for their students. How can you expect people to do their job without the tools they need? It’s like an auto mechanic without a wrench.
And finally, after improvement, the black or green belt will need an affordable tool to leave behind for the process owners. How can they hope to control the process without control charts? This is where most performance improvement efforts fail—in the control phase of DMAIC.
Quality Control
Shewhart started advocating the control of manufacturing quality back in the 1920s. Today, some companies use pass/fail gages and acceptable quality level (AQL) tables to manage quality. Others use control charts and histograms of data measured with digital calipers.

Software tools such as a Gage R&R template make it easy to input measurements and get results.
Many digital gages can be connected to a PC to capture each measurement. This data can be charted right at the workstation. Software choices vary from near real time analysis using Excel SPC templates up to ongoing monitoring using real-time SPC software. How you choose to monitor performance is up to you, but you will need to do it to sustain a competitive advantage.
Measurement Systems Analysis
Regardless of the type of measuring system you use, customers will want to know if your measurement system is capable. If the measurements are off, the quality is questionable. Gage Repeatability and Reproducibility (Gage R&R) software will make it easy to access your measurement methods and tools.
You may need Type I, Type II, Type III or Attribute Gage R&R.
- Type I to develop an initial capability (one appraiser, one part, one gage and 50 measurements).
- Type II to access Gage R&R for 10 parts, two to three appraisers and one gage.
- Type III to access Gage R&R for a CMM using 25 parts and one CMM.
- Attribute Gage R&R is used for pass/fail analysis using two to three appraisers and 10 or more parts.
Software tools make it easy to input measurements and get results.
Conclusion
Automating quality in manufacturing is rarely a one-size-fits-all decision. Depending on the size, mix and volume of production you will want tools that fit your company. There may be a need for high-end automation, standalone or Excel-based solutions, or some combination. Weigh all of the costs including training and ease of use. Regardless, you will want to use automated quality control and improvement software to maximize productivity and profitability while minimizing costs. Q
Looking for a reprint of this article?
From high-res PDFs to custom plaques, order your copy today!


