Quality Magazine logo
search
cart
facebook twitter linkedin youtube
  • Sign In
  • Create Account
  • Sign Out
  • My Account
Quality Magazine logo
  • NEWS
  • PRODUCTS
    • FEATURED PRODUCTS
    • SUBMIT YOUR PRODUCT
  • CHANNELS
    • AUTOMATION
    • MANAGEMENT
    • MEASUREMENT
    • NDT
    • QUALITY 101
    • SOFTWARE
    • TEST & INSPECTION
    • VISION & SENSORS
  • MARKETS
    • AEROSPACE
    • AUTOMOTIVE
    • ENERGY
    • GREEN MANUFACTURING
    • MEDICAL
  • MEDIA
    • A WORD ON QUALITY PUZZLE
    • EBOOK
    • PODCASTS
    • VIDEOS
    • WEBINARS
  • EVENTS
    • EVENT CALENDAR
    • IMTS
  • DIRECTORIES
    • BUYERS GUIDE >
      • Supplier Insights
    • NDT SOURCEBOOK
    • VISION & SENSORS
    • TAKE A TOUR
  • INFOCENTERS
    • Digital Quality Management Systems
    • NEXT GENERATION SPC & QUALITY ANALYTICS
  • AWARDS
    • ROOKIE OF THE YEAR
    • PLANT OF THE YEAR
    • PROFESSIONAL OF THE YEAR
  • MORE
    • Expert Columns
    • NEWSLETTERS
    • QUALITY STORE
    • INDUSTRY LINKS
    • SPONSOR INSIGHTS
  • EMAG
    • eMAGAZINE
    • ARCHIVES
    • CONTACT
    • ADVERTISE
  • SIGN UP!
Software

Software & Analysis

Measurement Systems Analysis

There are many ways to assess the quality of a measurement system.

By Jay Arthur
QM 1023 Software and Analysis MSA feature
September 27, 2023
✕
Image in modal.

There are many root causes of defects, mistakes, errors, and variation. One sometimes overlooked is measurement. A poor measurement system can let defective products slip through and send good products or scrap. That’s why companies need measurement systems analysis (MSA).

MSA will help evaluate your measurement methods and tools to determine if they are reliable and repeatable. Poor measurements can harm your productivity and profits. There are also ways to fail at MSA. Let’s look at ways to succeed and fail at MSA.

Gage Repeatability And Reproducibility (GR&R)

There are many ways to assess the quality of a measurement system. Gage Repeatability and Reproducibility (GR&R) uses a single gage, 10 or more parts, one to three appraisers and one or more trials per appraiser. Types 1-2 and Attribute are the most common types of GR&R.

Type 1 GR&R

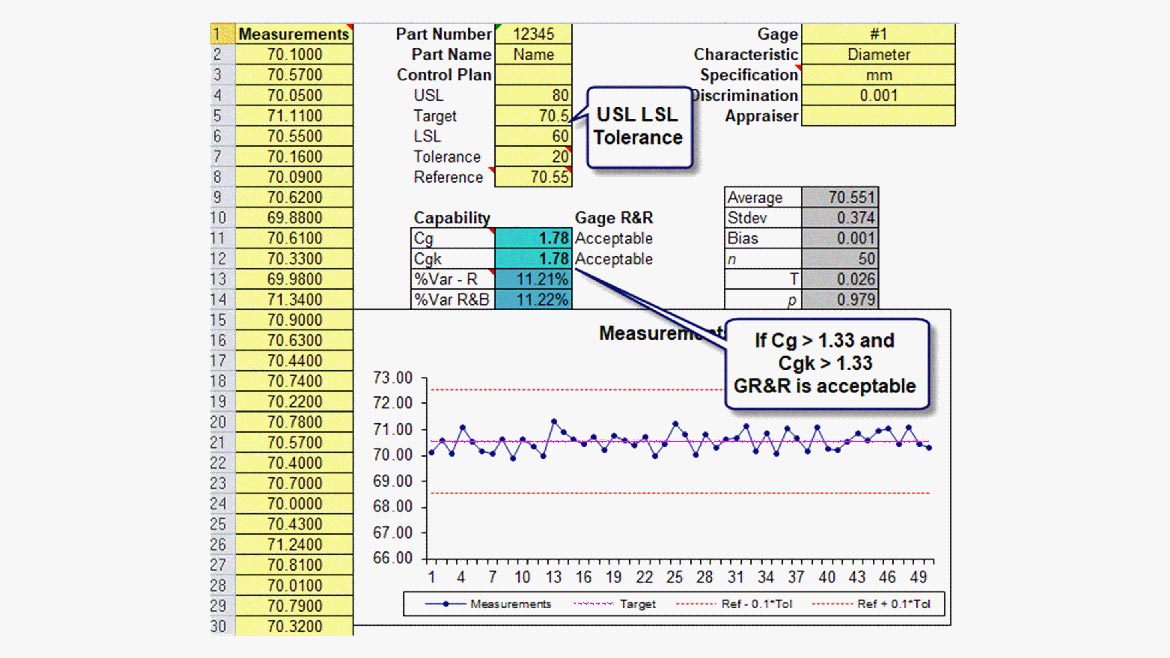
Type 1 GR&R uses one appraiser, one gage and 50 parts. It’s a good first step to assess your measurement system. Each part must have a known reference value (measured independently to a high degree of accuracy) and upper/lower specification limits or tolerance. Because the calculations are non-trivial, consider getting software to help with the analysis. Figure 1 shows a Type 1 GR&R where Cg and Cgk (capability) are greater than 1.33. The measurement system is acceptable.

QM 1023 Software and Analysis MSA Figure 1 Type 1 GRR Example
Figure 1: Type 1 GRR Example

Type 2 GR&R

To conduct a Type 2 GR&R you will need a single gage, two or more appraisers and 5-10 parts. Label each part so that you know which one is being measured. Have each appraiser measure each part at least twice. Have them do it randomly so that they can’t remember what the previous value was. Then input the data into MSA software to analyze GR&R.

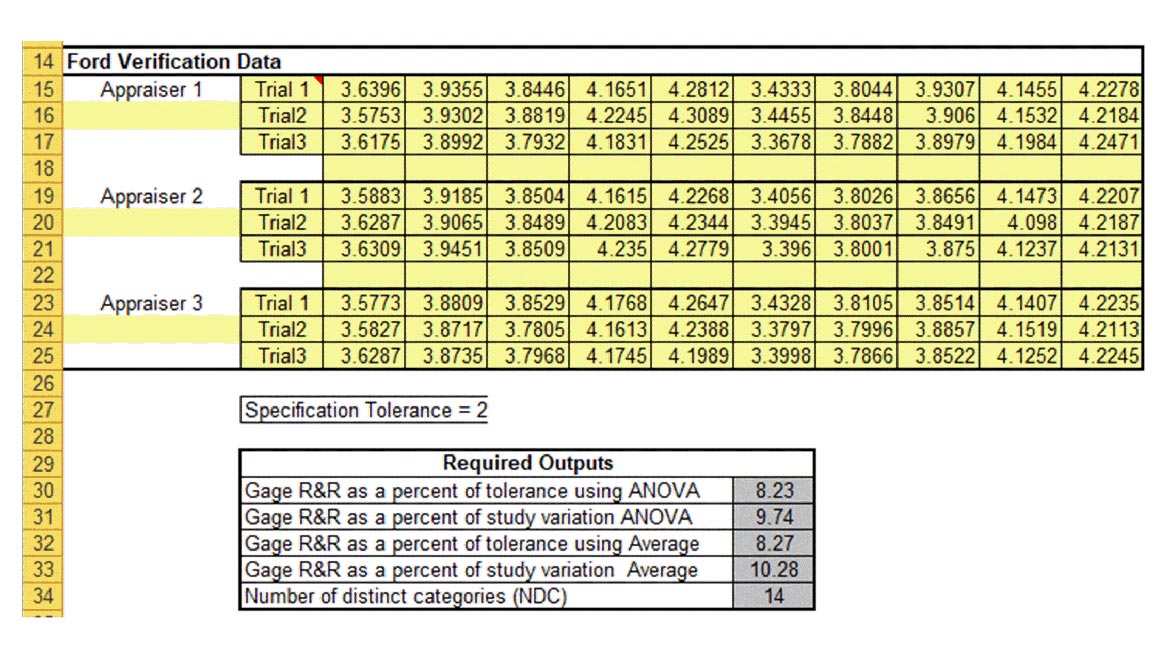
Ford® published verification data (Figure 2) that can be used to validate any MSA software.

QM 1023 Software and Analysis MSA Figure 2 Ford Verification Data
Figure 2: Ford Verification Data

There are at four main ways to analyze this data:

  1. Average and Range Method
  2. ANOVA Method
  3. Specification Tolerance Method (if you cannot measure enough part variation)
  4. Dr. Donald Wheeler’s Honest Gage R&R Method

The biggest mistake beginners make is using 10 parts from the middle of a production run. There won’t be enough part variation to get a good GR&R. You need bad parts to do a good GR&R or at least 5-10 parts that span the specification tolerance. You might want to pull parts from startup, middle and shutdown of a production. Or get parts from rework or scrap.

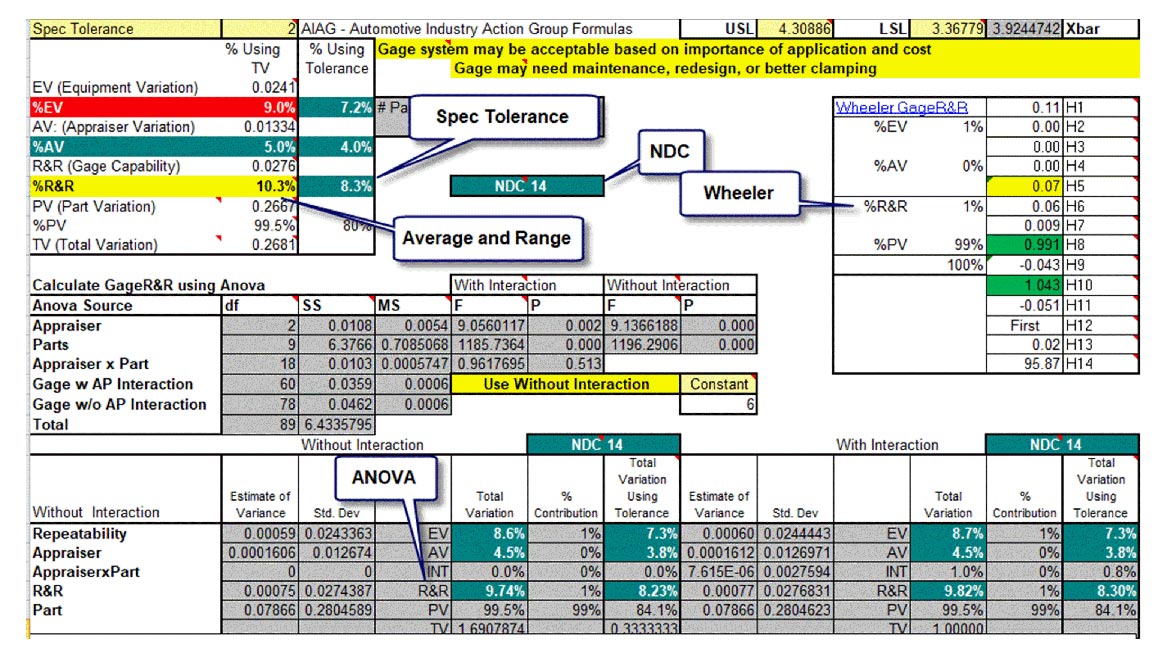
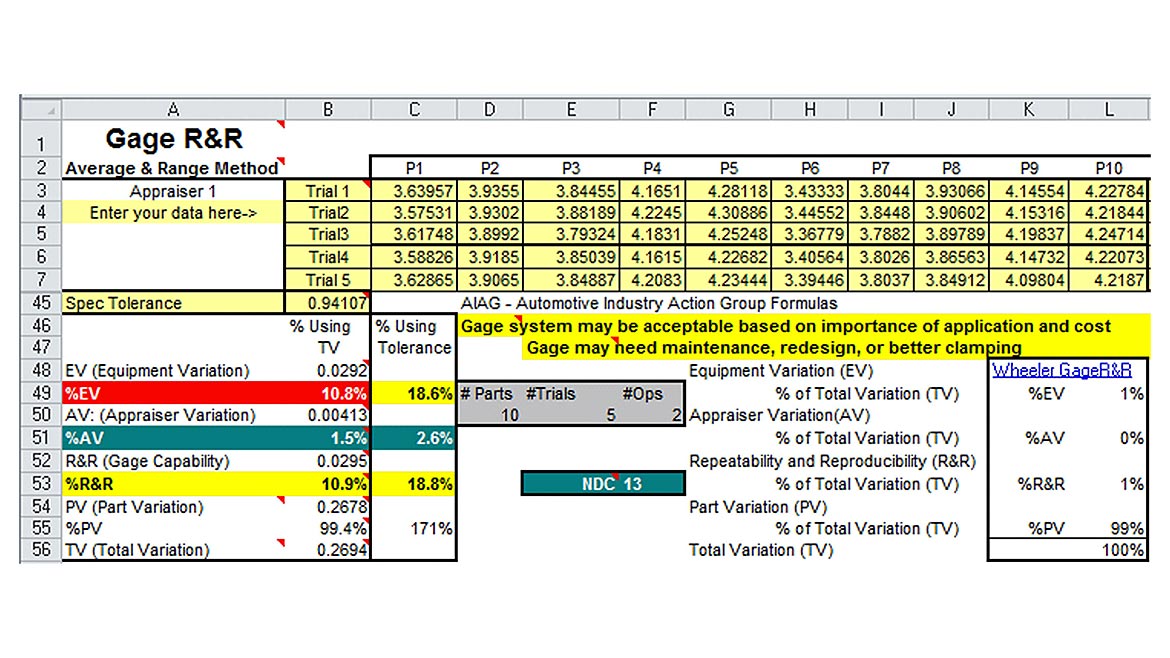
How will you know if you have enough part variation? There’s a calculation called NDC (Number of Distinct Categories) that must be greater than or equal to 5. Ford’s data has an NDC of 14. This example (Figure 3) shows all four methods:

QM 1023 Software and Analysis MSA Figure 3 Ford Verification GRR
Figure 3: Ford Verification GRR

Interpreting Results

If NDC >=5, then the analysis is straightforward. You will want most of the variation to be between the parts, and less than 10% to be caused by the measurement system (appraisers and equipment). In this case, the ANOVA method is less than 10% while the Average and Range method is just over 10%. If NDC < 5, there is not enough part variation to use either ANOVA or Average and Range Method.

Gage R&R System Acceptability

  • %R&R<10% - gage system okay
     (Most variation caused by parts, not people or equipment)10%>
  • % R&R<30% - may be acceptable based on importance of application and cost gage or repair< li>
  • % R&R>30% - Gage system needs improvement
    (People and equipment cause over one-third of the variation)
  • 30%>

How To Improve

  • If %EV (equipment variation) is greater than %AV (appraiser variation), then the gage may need maintenance, redesign, or better clamping.
    • Gage needs maintenance (gages can get corroded or worn)
    • Gage needs to be redesigned to be used more accurately.
    • Clamping of the part or gage, or where it’s measured needs to be improved (imagine measuring a baseball bat at various places along the tapered contour; you’ll get different results).
    • Excessive within-part variation (Imagine a steel rod that’s bigger at one end than the other. If you measure different ends each time, you’ll get widely varying results).
  • If %AV is greater than %EV, the appraisers may need better training because they are not getting similar results.
    • Operators need to be better trained in a consistent method for using and reading the gage.
    • Calibrations on the gage are unclear.
    • Fixture required to help the operator use the gage more consistently.

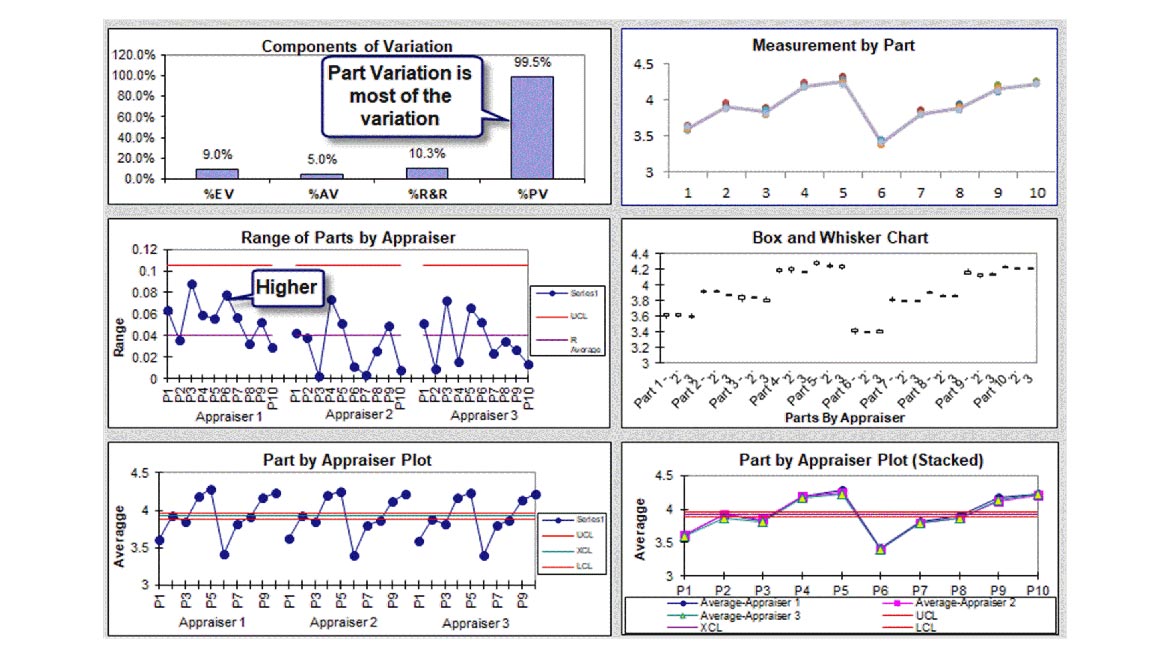
You can analyze the performance of each appraiser using graphs (Figure 4) provided by MSA software. Appraiser 1 range (variation) is slightly higher than appraisers 2 and 3.

QM 1023 Software and Analysis MSA Figure 4 Charts of Appraisers and Parts
Figure 4: Charts of Appraisers and Parts

Common Mistakes People Make

Many people don’t like the answer they get using Gage R&R. Most of the time, it’s because they didn’t follow the instructions for conducting the study. Here are some of the common mistakes I’ve seen:

  1. Forgetting that the Gage R&R study is evaluating their measurement system and NOT their products. Gage R&R does not care about how good your products are. It only cares about how well you can measure your products.
  2. Using only one part. If you only use one part, THERE CAN’T BE ANY PART VARIATION, so people and equipment are the ONLY source of variation.
  3. Using too many trials (if you use five trials, you have more opportunity for equipment variation).
  4. Using too many appraisers (if you use all three, you have more opportunity for appraiser variation).

Using a gage that measures in too much detail. If your part is 74mm +/- 0.05, then you don’t need a gage that measures to ten thousandths of an inch (0.0001) you only need one that measures to the hundredth of an inch (0.01).


"Using a measurement increment that is too large will throw away useful information. Using a measurement increment that is too small will add noise to your measurements."
- Donald J. Wheeler

Type 3 Gage R&R

Typical Gage R&R studies use 10 parts, 2-3 appraisers and 2-3 trials (3 x 3 x 10). What do you do if you use a coordinate measuring machine (CMM), not humans? A Type 3 GR&R study (Figure 5) uses 30 parts, one appraiser (CMM), 5 trials (1 x 5 x 30). This works like the Type 2 GR&R, except that there is only one appraiser. You might consider randomizing the parts for each successive run.
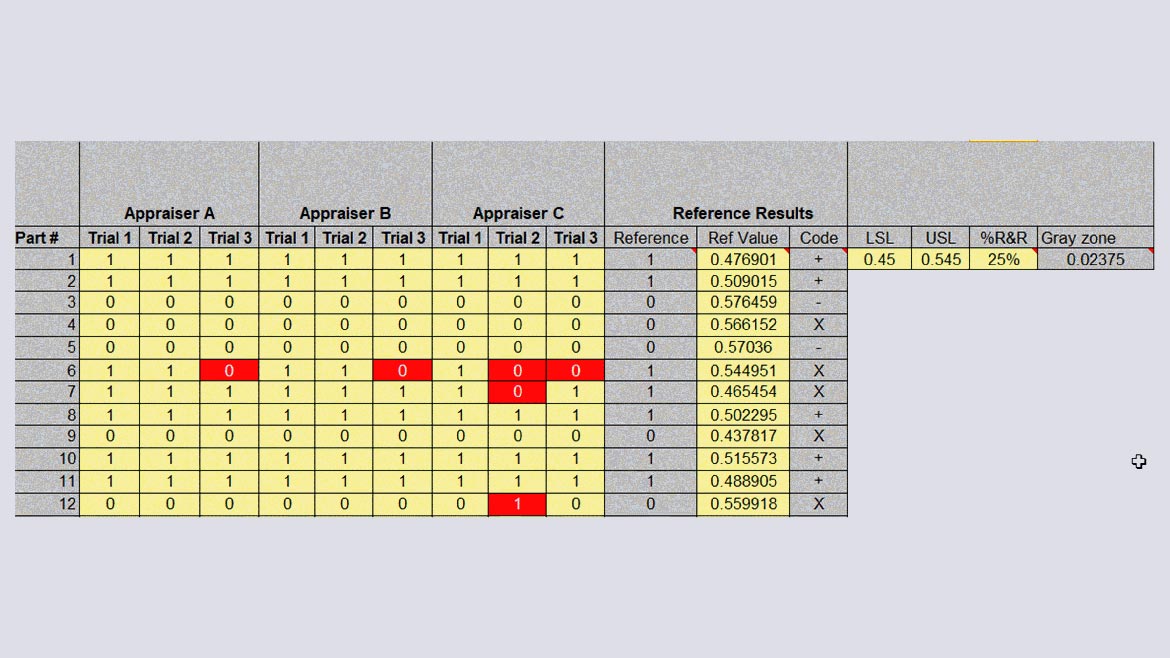
QM 1023 Software and Analysis MSA Figure 5 gage rr type 3 results
Figure 5: Gage RR Type 3 Results

Attribute Gage R&R

When using pass/fail gages or measurements, use attribute GR&R to access the measurement system. You will need 50 parts, 2-3 appraisers conducting 2-3 trials. You will also need reference measurements for each part measured to know if it passes or fails. Here’s an example from the AIAG (Figure 6). Each appraiser registers a pass (1) or fail (0) for each part three random times. This is compared to the reference value and spec limits. Red cells show errors. Appraiser C seems to have more misses.

QM 1023 Software and Analysis MSA Figure 6 Attribute R&R Data
Figure 6: Attribute R&R Data

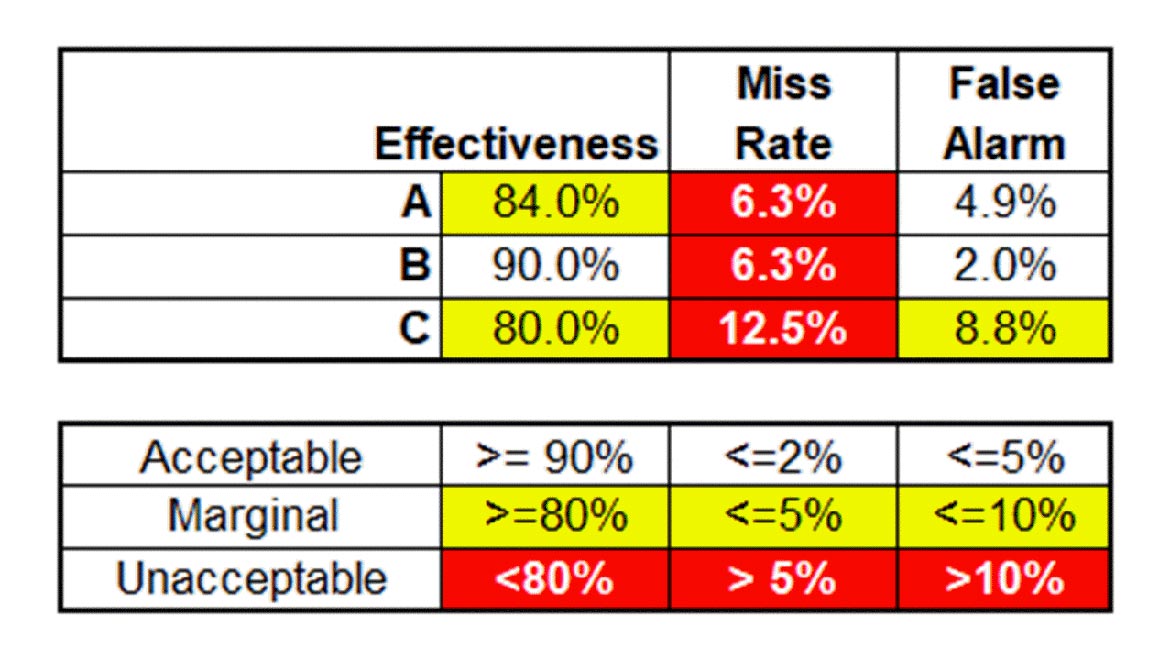
This is then used to assess the gage system. In this case the miss rate is too high (Figure 7). Appraiser C’s miss rate is almost twice as high as appraiser A and B, and the false alarm rate is too high. So, this measurement system needs improvement. Pass/fail gages can wear over time and cause problems with accuracy.

QM 1023 Software and Analysis MSA Figure 7 Attribute R&R Results
Figure 7: Attribute R&R Results

Conclusion

Measurement systems can reject good parts and accept bad ones. Measurement Systems Analysis can help determine how to improve the measurement system to prevent waste and rework.

If you aren’t already using MSA, your customer may demand it at some point. It’s better to get ahead of their request rather than scrambling to figure out MSA.

References:

  1. AIAG (Automotive Industry Action Group) Measurement Systems Analysis (MSA) Fourth Edition (2010).
  2. Wheeler, Donald J., Problems with Gauge R&R Studies, Quality Digest, Jan. 3, 2011. https://www.qualitydigest.com/inside/twitter-ed/problems-gauge-rr-studies.html
KEYWORDS: analysis manufacturing measurement systems metrology

Share This Story

Looking for a reprint of this article?
From high-res PDFs to custom plaques, order your copy today!

Jay Arthur teaches business people how to Turn Data Into Dollars® using QI Macros for Excel. He is the author of Agile Process Innovation, Lean Six Sigma Demystified (2nd), Lean Six Sigma for Hospitals (2nd) and QI Macros. Download a free 30-day trial at www.qimacros.com/30. For more information, call (888) 468-1537, email [email protected] or visit www.qimacros.com.

Recommended Content

JOIN TODAY
to unlock your recommendations.

Already have an account? Sign In

  • 2024 Quality Rookie of the Year Justin Wise 1440x750px banner with "Quality Rookie of the Year" logo inset

    Meet the 2024 Quality Rookie of the Year: Justin Wise

    Justin Wise is an exceptional individual who has been...
    Aerospace
    By: Michelle Bangert
  • Man with umbrella and coat stands outside while it rains at night looking at a building.

    Nondestructive Testing: Is there an ethics problem?

    I was a whistleblower who exposed fraudulent activities...
    NDT
    By: Dale Norwood
  • Unraveling Deflategate: Football stadium with closeup of football on field

    Unraveling the Tom Brady Deflategate

    The Deflategate scandal erupted following the 2014 AFC...
    Measurement
    By: Greg Cenker and Henry Zumbrun
Manage My Account
  • eMagazine Subscriptions
  • Newsletters
  • Online Registration
  • Subscription Customer Service
  • Manage My Preferences

More Videos

Sponsored Content

Sponsored Content is a special paid section where industry companies provide high quality, objective, non-commercial content around topics of interest to the Quality audience. All Sponsored Content is supplied by the advertising company and any opinions expressed in this article are those of the author and not necessarily reflect the views of Quality or its parent company, BNP Media. Interested in participating in our Sponsored Content section? Contact your local rep!

close
  • Key Takeaways for Quality Leaders
    Sponsored byComplianceQuest

    Key Takeaways for Quality Leaders from the 2026 Gartner Magic Quadrant™ for QMS

  • This image shows a person seated next to a Bobcat T66 compact track loader.
    Sponsored byPolyWorks by InnovMetric

    Supercharging Digital Gauging at Bobcat North America

  • Dorsey Calibration Lab photo by Tom LaBarbera Picture this Studios
    Sponsored byDorsey Metrology International

    Ensuring Product Quality in a Competitive Manufacturing Landscape

Popular Stories

This image shows a person seated next to a Bobcat T66 compact track loader.

Supercharging Digital Gauging at Bobcat North America

a professional in the aviation field performing maintenance, repair, and overhaul (MRO) work

Manufacturing Retention: Strategies for Improving Company Culture, Engagement and Skill Development

Dorsey Calibration Lab photo by Tom LaBarbera Picture this Studios

Ensuring Product Quality in a Competitive Manufacturing Landscape

2026 Quality Professional of the Year!

Events

June 22, 2026

Automate 2026

Automate is North America's largest robotics and automation event — and the best place to take your ideas from insight to impact.
 
Our show floor features the world’s leading automation solutions, from AI and robotics to motion control, vision systems, and more. Plus, our educational conference is second to none, led by the brightest minds in automation today.
 
Ready to transform the way you work? Take the next step at Automate.
July 14, 2026

Quality Leaders Forum: Better Communication, Better Quality Data

The Quality Leaders Forum is a quarterly, editor-moderated fireside chat series hosted by Quality Magazine, featuring candid conversations with senior manufacturing and operations executives shaping enterprise-level quality.

View All Submit An Event

Products

Lean Manufacturing and Service Fundamentals, Applications, and Case Studies

Lean Manufacturing and Service Fundamentals, Applications, and Case Studies

See More Products
Quality Podcast Channel Custom Content

Related Articles

  • ASTM Offers Guide for Measurement Systems Analysis

    See More
  • Automated factory engineer analyzing smart manufacturing system.

    Smart Performance Charts (SPC)

    See More
  • An engineer holds a laptop with mock-up charts. In the blurred background, three people are working together at a desk.

    Before and After Control Charts, Pareto Charts and Histograms

    See More

Related Products

See More Products
  • Measurement and Gaging DVD

  • Failure Mode Effects Analysis (FMEA) DVD

  • Work Measurement DVD

See More Products

Related Directories

  • Starrett-Bytewise Measurement Systems

    Starrett-Bytewise provides in line, continuous, dimensional profile measurement technology. Applications include tires, rubber extrusion, plastic extrusion, roll forming, pipe & tube, and wire & cable.
×

Stay in the know with Quality’s comprehensive coverage of
the manufacturing and metrology industries.

Newsletters | Website | eMagazine

JOIN TODAY!
  • RESOURCES
    • Advertise
    • Contact Us
    • Directories
    • Manufacturing Division
    • Store
    • Want More
  • SIGN UP TODAY
    • Create Account
    • eMagazine
    • Newsletters
    • Customer Service
    • Manage Preferences
  • SERVICES
    • Marketing Services
    • Market Research
    • Reprints
    • List Rental
    • Survey/Respondent Access
  • STAY CONNECTED
    • LinkedIn
    • Facebook
    • YouTube
    • X (Twitter)
  • PRIVACY
    • PRIVACY POLICY
    • TERMS & CONDITIONS
    • DO NOT SELL MY PERSONAL INFORMATION
    • PRIVACY REQUEST
    • ACCESSIBILITY

Copyright ©2026. All Rights Reserved BNP Media, Inc. and BNP Media II, LLC.

Design, CMS, Hosting & Web Development :: ePublishing