3D Stereo Camera Repeatability Measurement
Understand the process to determine measurement repeatability of a stereo 3D camera.
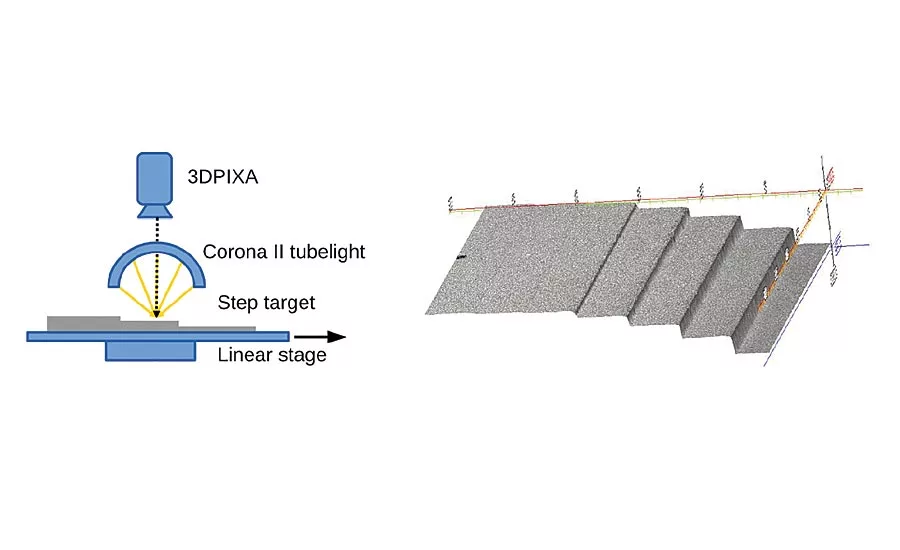
Figure 1: Schematic illustration of measurement setup (a); rendered 3D image of the step target (b).
In this article we outline the procedure for quantifying device repeatability of a 3D 15μm stereo imaging camera. Repeatability of a measurement refers to the variations in repeated measurements made with the same measurement device under identical conditions. A given variability among repeated measurements can therefore be ascribed only to errors due to the measurement process itself.
In the practical use case, the camera is typically one of a variety of components in a measurement system. Other components are the light source or the mechanical transport unit used in the scanning process. It is therefore important to distinguish repeatability of the camera and the measurement process that involves other components. Another important aspect to consider is the aforementioned requirement for repeatability assessment for stable environmental conditions. That means that repeatability is to be evaluated by excluding transient processes in the measurement or “measurement bias,” for instance, the warm-up phase of the camera.
Measurement procedure
A schematic illustration of a typical measurement setup is shown in Figure 1(a). The components shown are a camera module, a line illumination, a translation unit (high-precision motorized linear stage, repeatability error <15µm) for translating the measurement target under the camera and a step target (illustrated in Figure 1(b)).
There are various aspects to consider when performing repeatability measurements:
Component warm up: camera, light source and translation stage undergo mechanical variations if their body temperature changes. It is therefore essential to control temperature and allow enough time for the setup to reach a temporal equilibrium.
Environment: As mentioned before, temporal changes influence the camera measurement performance. For the repeatability measurement, environmental temperature has to be stabilized and no stray light has to be ensured. Also, the measurement setup has to be protected from shocks, e.g. nearby working machines generating vibrations.
Light source: It has to be ensured that the light source generates a uniform and temporally stable light field. Variations result in intensity changes in the image data, which are not to be considered when evaluating camera module repeatability.
Translation stage: It has to be ensured that the scanning process is stable with respect to positioning of the target. When evaluating camera module repeatability, the location of the target in the image data has to be precise.
Step target: The measurement performance of stereo imaging based 3D measurement is always dependent on the surface quality of the target. The repeatability measurement process is therefore defined for a target with good surface texture and no angle dependent appearance changes (e.g. gloss or specularities).
Image acquisition: The process of acquiring a large amount of repeated measurements should be performed in an automated fashion to prevent introducing additional errors.
Number of measurements: Repeatability is quantified in terms of standard deviation, which is a parameter of the normal distribution. The real standard deviation of the measurement process is unknown and has to be estimated via measurements. A larger number of measurements results in a better estimate.
The measurement procedure contains an image acquisition step, and a data processing step.
Note: It makes sense to verify that the acquired image stack is void of displacement due to mechanical imprecisions in the scanning process. If displacement exists, it has to be corrected before analyzing the image data for camera repeatability. If not corrected, it could lead to a reduction in the measurement performance that is due to the mechanical setup and not due to the camera. For the camera repeatability, we are only interested in the camera, not the mechanical peripherals and their uncertainties.
Analysis and interpretation of the results
The 400 scans of the step target were converted to disparity images using the camera and correlation window size 27 x 27 pixels. To analyze repeatability of the measurement at different heights on the target, measurement regions have to be defined. We illustrate in Figure 2 the square regions of size 100 x 100 pixels considered for the analysis.
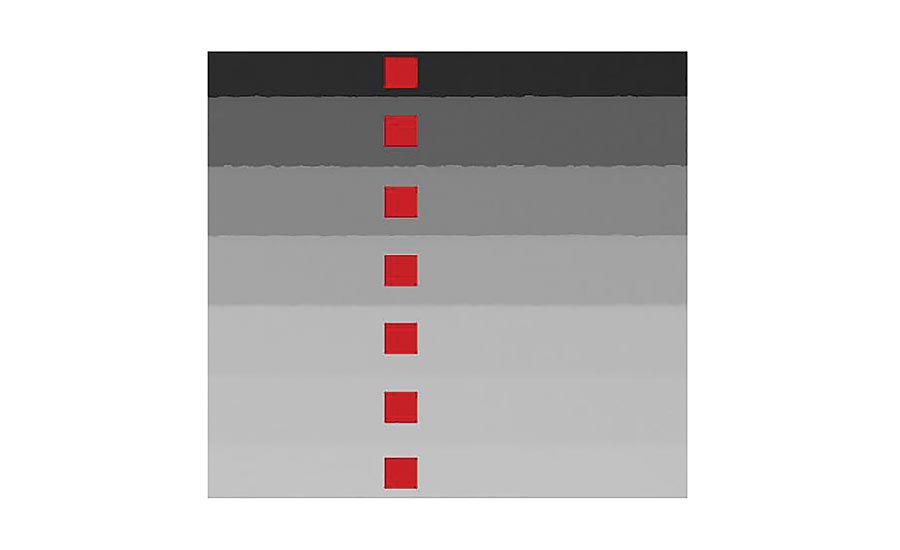
Figure 2: Disparity image and measurement regions in red color.
Extracting an average value for each of seven height steps in each of 400 images corresponding to the measurement region is the basis for further analysis. When plotting these values over measurement time, it can be seen that for our camera, there exists a change in disparity value over approximately the first hour of measurements (see Figure 3). This is the time our particular measurement setup requires to reach temperature equilibrium. The functional behavior of the measurement can be explained by the dynamics of thermal coupling of, for instance, light source, the camera and the mechanical carrier connecting these components. As mentioned before, for analyzing the repeatability of the camera module, this bias in the warm up phase should not be considered.
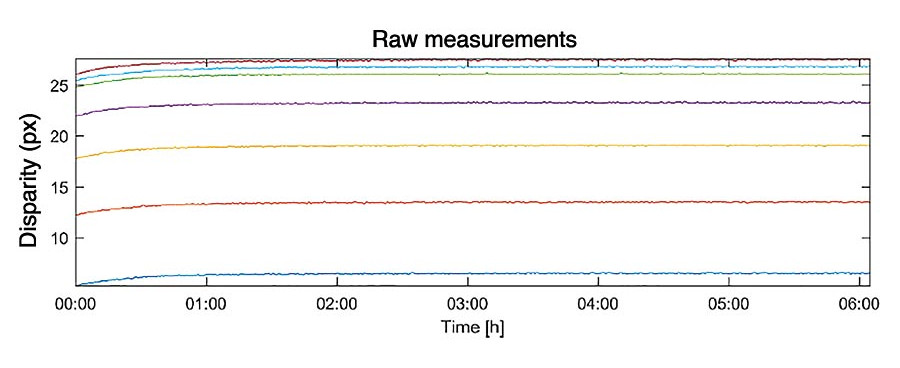
Figure 3: Measurement values for each of the seven steps on the target plotted over measurement time.
To correct the bias, two approaches can therefore be followed:
- Exclude the biased measurements
- Fit the bias function and subtract it from measurements
We follow the second approach and correct for bias. A corresponding bias corrected plot is shown in Figure 4.
Note: The residual measurement error considered for the repeatability of the camera module is a random type error with normal distribution. If a fit function is used to subtract the bias, it has to be ensured that the residual measurement values correspond to normal distributed random errors.
The bias corrected measurement values in Figure 4 are used to determine repeatability. We define repeatability by the standard deviation of the normal distributed random error in repeated measurements. Standard deviation σ is computed according to the following equation:
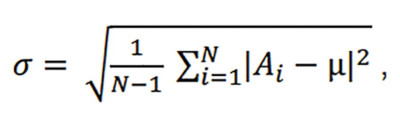
where
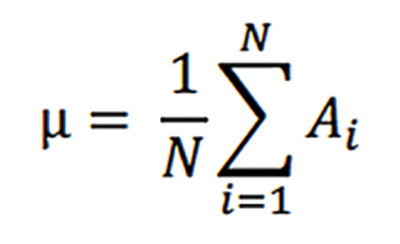
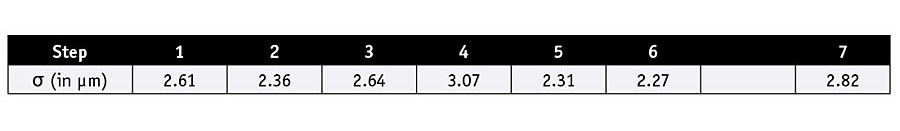
and Ai is the i-th measurement value and N the number of bias corrected measurements. For the 15µm camera module, see the chart at the top for the standard deviations that were found.
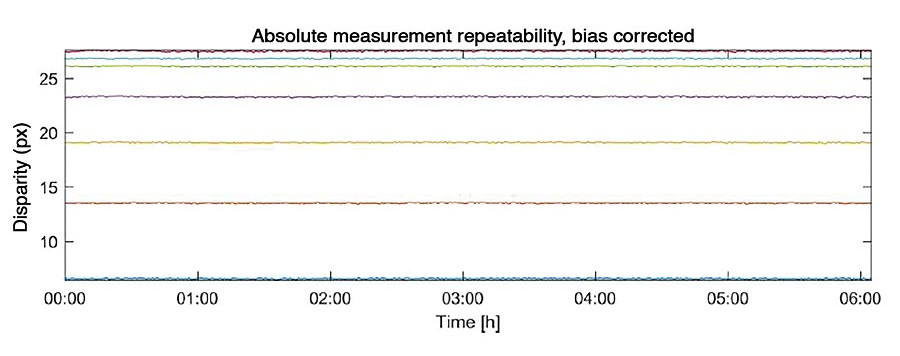
Figure 4: Bias corrected measurement values for each of the seven steps on the target plotted over measurement time.
If we assume that this estimated standard deviation of normally distributed measurement error values describes the distribution of errors of the measurement process, we can interpret the result such that 68% of the height measurements lie within the range of 1s. For the 15 µm 3DPIXA, this is approximately 2.5µm. Further, 99.99% of all height measurements lie within the range of 4s, which is approximately 10.3 µm. Obviously, statistical outliers might lie beyond this value.
Summary
The process to determine measurement repeatability of a stereo 3D camera is described and illustrated. The importance of correcting raw measurements for bias was illustrated by example. For the camera module considered in the experiments, an approximate standard deviation of 2.5 µm was found.
It shall be noted explicitly that factors such as correlation window size or the level of image noise also influence camera repeatability. For measurements of a specific use-case, repeatability should be evaluated under realistic conditions of a given application. V&S
Looking for a reprint of this article?
From high-res PDFs to custom plaques, order your copy today!


