Can GD&T Extraction Really Be Automated?
Yes.
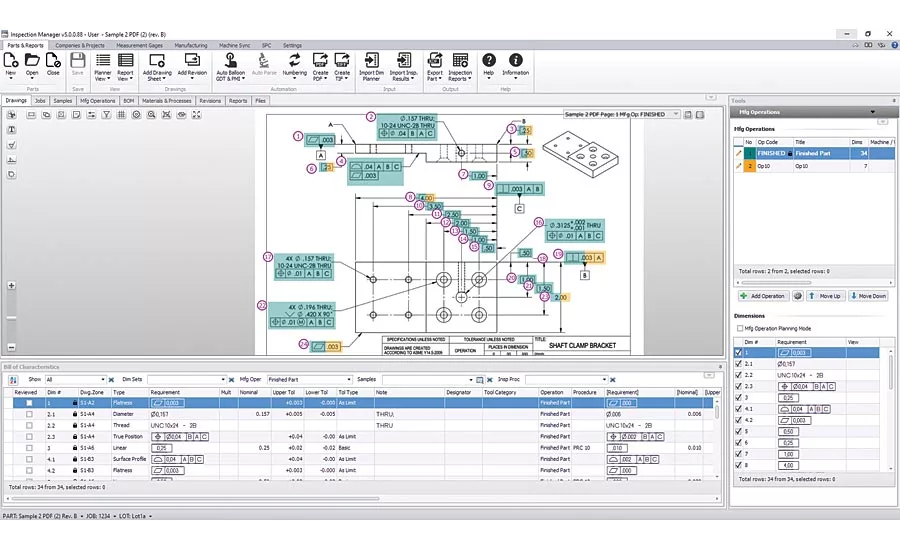
Auto-ballooned drawing. Courtesy of High QA Inc.
Most quality technicians have been exposed to and probably use geometric dimensioning and tolerance (GD&T) information in their day-to-day work duties. After all, GD&T has been in use for over 50 years. The creation of it is credited to Stanley Parker who developed the notion of “true position.” GD&T more accurately defines the features of a part using a variety of standardized symbols. The “language” of GD&T has four core elements: size, form, location, and orientation. There are an additional ten primary feature control symbols that round out the GD&T language. The total 14 are:
- Straightness
- Flatness
- Circularity
- Cylindricity
- Profile of a Line
- Profile of a
- Surface
- Perpendicularity
- Angularity
- Parallelism
- Symmetry
- True Position
- Concentricity
- Circular Runout
- Total Runout
On a part drawing, the appropriate GD&T symbols are included, along with the numerical dimension and tolerance for each feature, all of which are usually placed within a frame. For those unfamiliar with reading drawings, these “feature frames” look like they contain secret codes. Additional frames are connected if there is more than one “message” needed for a particular feature. The GD&T code contains pertinent information to be sure!
However, even the standardized language of GD&T requirements can be interpreted in different ways by the OEM and the various suppliers in the workflow. For example, when a subcontract shop sees a GD&T callout on a print, does it know if the OEM is asking to measure that feature as a limit or a bilateral from the nominal? If there is a surface profile callout for 0.003”, does the receiving supplier know if it is to stay above the surface nominal by no more than 0.003”, or if the part needs to stay within plus or minus 0.0015” of the surface nominal? Details matter. There are bumps in the process if there isn’t clear and concise communication upfront with common nomenclature. It’s unproductive and costly to get all the way through building a manufacturing process, then pumping out a few parts before sending a report to your OEM customer only to hear, “Wrong!”
In addition to interpretation snafus, the manual extraction of GD&T from a part drawing into a format for quality tracking and reporting can literally take multiple days for complex parts. Many of us are certainly familiar with the push in manufacturing to automate, to be data-driven, to be lean, to be paperless, to be “lights out”—all are part of the current elements comprising Industry 4.0 that are delivering such benefits as reducing costs, improving part quality, and quickening delivery times. The quality sector is also familiar with the term Quality 4.0. There have been strides in that realm, too, with the emergence of automated gaging, machine tool probing with automated feedback, automatic process control adjustments on the fly, and more. The one area that’s been lagging surrounds data extraction from 2D drawings, and 3D models, where some of the key data might be missing or they raise more questions than answers. Several dimensional measurement-related software products have made incremental improvements, however, converting the GD&T symbols has been challenging to even the most brilliant minds. Recent research shows that 75% of us still pull out the pencils to “balloon” the drawing or mark up a PDF printout of the model and create yet another Excel sheet to get the data and GD&T instructions in some sort of digital format. This is also the stage to define and clarify customer requirements. Actual machined part geometries are then manually tracked, and compared against this so-called “database,” which really is only a file-based data storage in one or more folders that are disconnected and don’t communicate well, if at all, let alone help us to make important process decisions. We refer to these independent files and folders as “islands” of information, which are the opposite of a centralized database with a single set of accurate data.
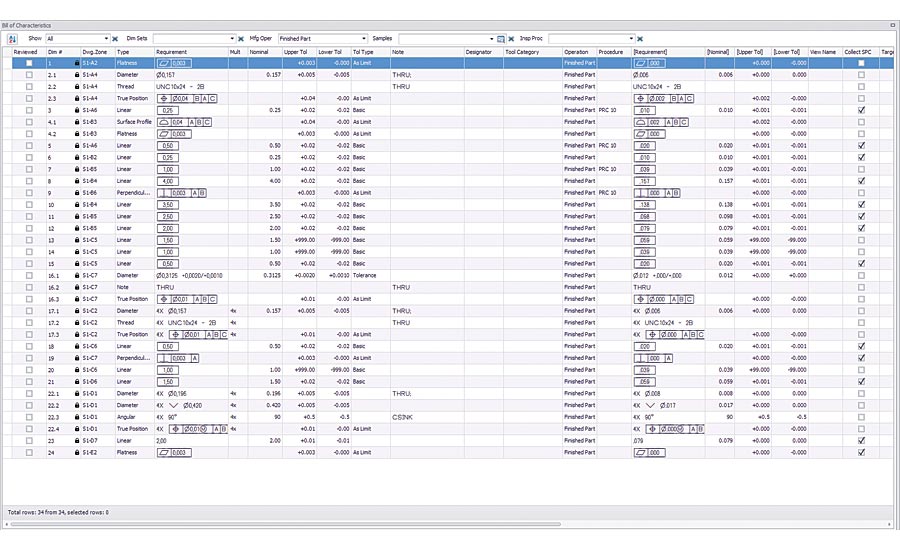
Bill of Characteristics. Courtesy of High QA Inc.
These traditional methods are grossly inefficient. Each step in the manual process provides an opportunity to introduce errors to the process, plus it creates a huge burden, liability, and workload to an already typically over-taxed quality function. There’s also the flipside of applying too many digital technologies that can put manufacturers in the position of possessing massive amounts of data yet not knowing exactly which pieces are useful. If a shop doesn’t have reliable and consistent inputs, and the data is scattered over multiple computers, servers, and databases that don’t interact well, this makes developing accurate and trustworthy data impossible. Plus, when an auditor comes in, there is no way to quickly access the information they require. Centralized data is powerful data. Data should be accessible from a common location in ways that deliver meaningful information. Companies inherently know that building inspection plans in spreadsheets only to fill them out manually, send them to a customer, and never look at them again, is wasteful work. Ideally, storing all the quality data in a centralized repository that is quickly retrievable and that can be compiled in a variety of metrics is the goal. For example, the ability to pull up any job record and view its current status ensures the project is on track for a timely delivery.
Here’s the hopeful news: The only transparent wall between where the industry is today, and the ideal data scenario described above is at the initial data entry point. Most manufacturers are already doing the work required to produce this level of transparency and insight into their processes. They just need to optimize the way they store the data. New solutions are available now that automatically and accurately extract GD&T and the entire feature frame data from the part drawing. Scanning the 2D drawing or 3D models or a PDF only once for each part assures that dimensions are defined and numbered the same way on all suppliers’ drawings. With a single source for all dimensional information, inspection results are easily identifiable and can be compiled in a trend analysis showing the inspection results in relation to the specifications. Using a common language, an OEM can resolve data collection, interpretation, and reporting inconsistencies by presenting every supplier with a consistent set of standards. That information includes not only drawings with part dimensions but also establishes a standard identification system for inspecting the characteristics of a part and recording the results. Manufacturers can achieve standardized identification of part requirements by annotating drawings with numbered callouts or balloons that point out individual part features. The balloon numbers correspond with numbers on a bill of characteristics that lists dimensions, tolerances and other requirements. That way, every supplier producing a certain part is on the same wavelength and can use the same drawing balloon information to make the part, inspect it, and report on the results. This routine is especially helpful if multiple suppliers are making the same part and need to deliver manufacturing and inspection data to the OEM in an identical format.
In addition to deciding how to number a drawing for manufacturing and inspection, the OEM can also create an inspection plan that includes instructions pertaining to inspection frequency and critical dimensions. For example, the plan might dictate which part dimensions require 100 percent inspection. From the OEM’s point of view, this procedure can take information from any number of suppliers to quickly determine if the parts are in tolerance. The inspection plan can also include standardized serial numbers. Because all of the data is stored digitally, in one central database location, it’s searchable and retrievable in a matter of seconds. Standardizing part feature identification and inspection plans also helps generate supplier quotes that are easily comparable. From the subcontractor’s viewpoint, these new technologies better manage inspection plans, results, and can automatically generate reports in a standard format such as ISO, BSI and ASME metrology standards, plus FAI/ AS9102, Medical Industry Standards, AIAG/PPAP, and other custom forms. The job shop’s OEM customers and auditors often require these today.
Even further, some of these new tools include integrated statistical process control (SPC) packages that track quality parameters and provide analysis in real-time. As part dimensions change during manufacturing operations and move toward defined limits, the programs enable a manufacturer to take action immediately without waiting for post-process inspection of the entire production lot. When inspection data are taken from a digitally connected inspection device or are manually entered into an intuitive touch-screen device on the shop floor, these new software tools immediately present the data as a dynamic graph that visually displays the part’s measured dimensions in relation to specifications.
Today’s automation technology gives us the best chance at delivering useful information from the beginning of the process, right from the drawing when it is “ballooned” for inspection and fabrication. New one-click digital automation allows us to capture all the relevant GD&T data from the drawing. Using new quality information management software to get all contributors in the manufacturing process on the same page with part dimensions, tolerances, and data reporting maximizes process efficiency. Most importantly, an automated, centralized, integrated approach to data management can significantly reduce errors and provide consistent product quality. These tools are a colossal leap in the use of Mr. Parker’s GD&T “language” in a most effective way. Q
Looking for a reprint of this article?
From high-res PDFs to custom plaques, order your copy today!


