Destroying Materials is Critical to Saving Lives
Recent developments and improvements in testing equipment, sensors, and knowledge have led to a significant increase in high speed and high rate material testing efforts.
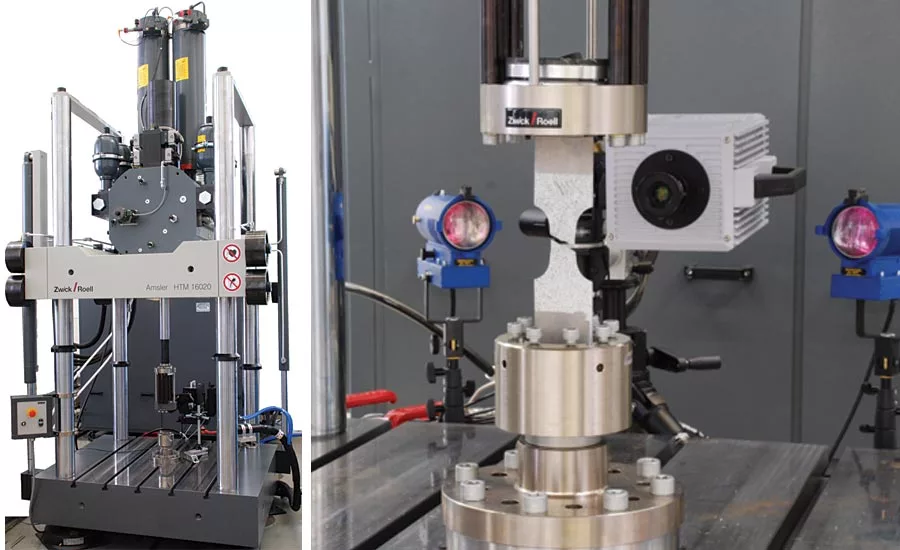
An example of a high speed servo-hydraulic test machine with a high speed camera and piezoelectric load washer for testing at high speeds.
Cars have become such an integral part of our lives. A car has long passed the point of being a necessary means of transportation, now becoming a symbol of independence and free-mobility, and sometimes even an expression of our personality. While met with an ever-growing appetite for style and comfort, automobile manufacturers and their suppliers at the same time are dedicating significant development efforts to the various materials used for the body of a car, despite the fact that these are more often than not hidden behind the shiny layer of paint. The majority of consumers never see, feel, or even consider this aspect when choosing a car.
In almost every component, automotive materials must be subjected to an extensive range of mechanical tests to ensure that design targets are met, before they are approved for the application. The vast majority of material tests are performed at slow (or quasi-static) speeds or rates, which are suitable for lab equipment conditions, and provide engineers with a good understanding of material behavior. Nevertheless, automotive manufacturers and material suppliers realize there is a disconnect between these ideal lab conditions and real-life conditions.
Automotive components are typically fabricated at speeds or rates ~100-1,000 times higher than most testing rates. Moreover, and more critical, automotive crash events imply even higher deformation rates that could be ~10,000-100,000 times faster than conventional testing rates.
This significant “orders-of-magnitude” difference between the predominant material testing rates and the rates associated with a crash is not ignored, nor is it simply checked at a late stage in the design process by performing “automobile crash tests” with crash dummies, as the latter would be too late and too costly. Rather, a very small but unique set of material tests is actually performed behind the scenes to address this issue and help engineers in designing an automotive structure with the right combination of materials early on in the design phase. This set of tests comprises a suite of mechanical tests (pull tests, crush tests, bending tests, etc.) that are performed over the entire spectrum of deformation rates, from low to medium to high rates. By doing so, the changes in material strength/ductility relationship as a function of deformation rate can be captured and used for improving our predictions of material response during an actual crash event.
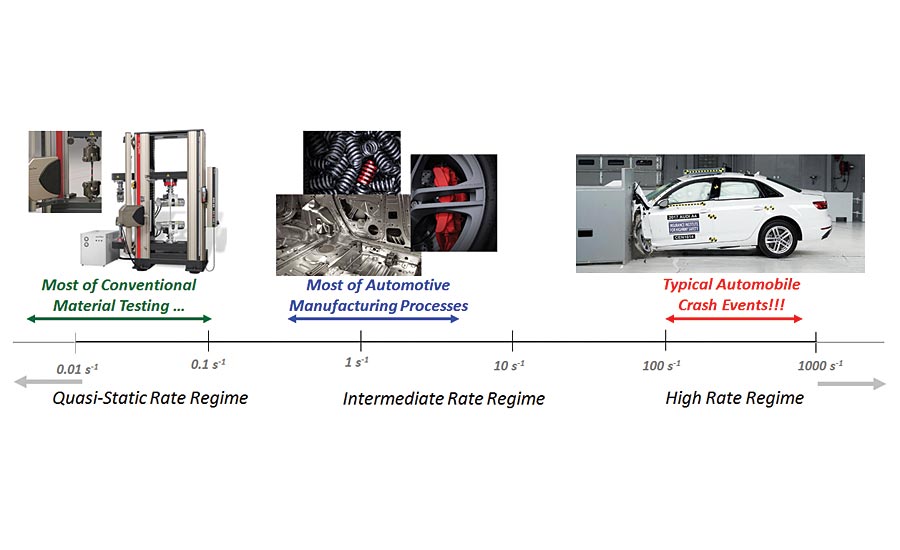
The “material deformation rate” scale
At the top of the page is an example of the strength/ductility (stress/strain) curves obtained by multi-rate tension testing for two different types of automotive steels over the same range of strain rates spanning from low (~0.005 s-1) to high (~500 s-1). The steel on the left shows small and uniform “sensitivity” to the deformation rate; the curves are similar in shape and they indicate a small increase in material strength and ductility as the speed of deformation increases. The alternative steel grade, on the other hand, shows large and non-uniform “sensitivity” to the deformation rate. We see that not only the curves change shape and angle, they indicate a substantial increase in material strength, with almost no effect on ductility as the speed of deformation increases. This data would be crucial for the appropriate design of structural parts using either type of steel. Accounting for the small or large changes in material strength and ductility as we approach crash conditions allows for an optimum design of a car structure with the best performance and safety merits.
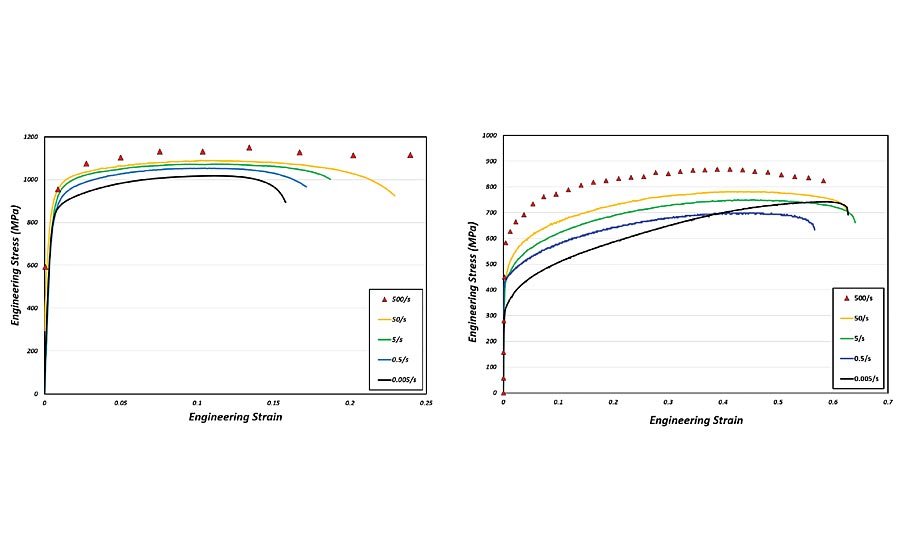
Two materials showing completely different strength/ductility responses (stress/strain curves) to changes in test rates from low (~0.005 s-1) to high (~500 s-1).
Due to their complexity, these crucial “multi-rate” tests represent a small fraction of the quasi-static tests performed routinely. If we look at pull (or tension) tests for instance, such “multi-rate” tests are performed in a similar fashion, yet require machines that can travel much faster with sensors that can provide quality data at much higher frequencies. High speed servo-hydraulic machines have been used to achieve a wide range of pull speeds covering the full spectrum of deformation rates. In these machines, conventional load cells are replaced with piezoelectric load washers to enable accurate load measurements at higher acquisition rates.
Contact sensors are replaced with non-contact position sensors for accurate displacement measurements at higher speeds. In many cases, high speed cameras are coupled with these machines to track the material sample as it undergoes deformation during the test, and thus obtain more direct information about strain evolution within the material.
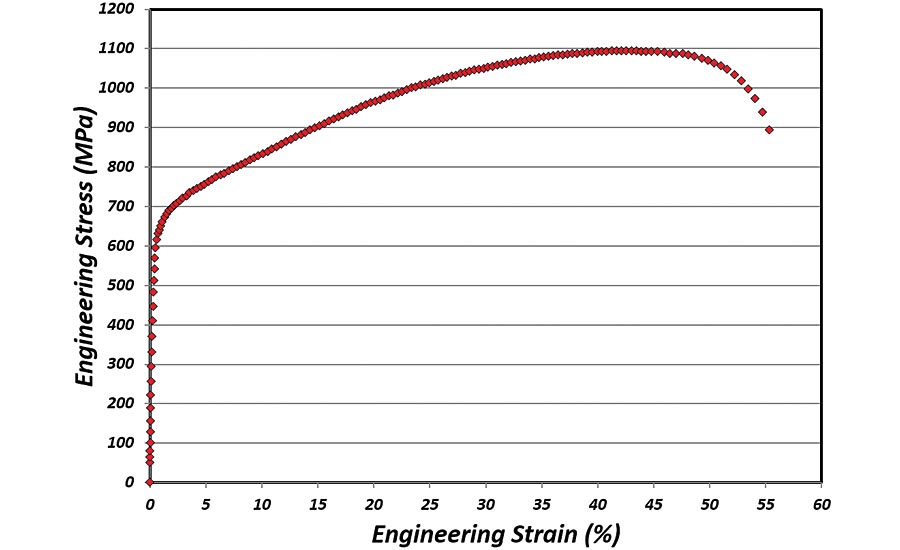
A stress/strain curve with a high density of data points for a high speed test performed at ~750 s-1.
However, this type of testing has been challenging, requiring additional testing skills and innovative approaches for testing and measurements to produce high fidelity data at such extreme conditions. This is why the curves shown earlier at high strain rates are not as smooth as those corresponding to the quasi-static rates.
Despite this complexity, recent developments and improvements in testing equipment, sensors, and knowledge have led to a significant increase in high speed and high rate material testing efforts, which in turn has led to improvements in hardware and testing approaches. Refinements to the designs of these special high speed servo-hydraulic machines, and optimization of the mass of the moving components, have led to fewer issues associated with the quality of collected load data. Additional optimization of test samples beyond the prescribed geometries suggested in the testing standards, and the use of direct load measurements by sample-mounted strain gages are also responsible for improving the quality of load measurements. Analysis of digital images captured with high speed cameras during testing now offers a thorough evaluation of material deformation and failure. The improvements in camera resolution at higher capture rates increase the accuracy and number of data points; strains accumulated within the material test sample are now denser and more reliable thus improving the quality of the developed stress/strain curves. These developments and more make obtaining high fidelity stress/strain curves at very high strain rates a real possibility, as shown in the example here for a test performed at ~750 s-1.
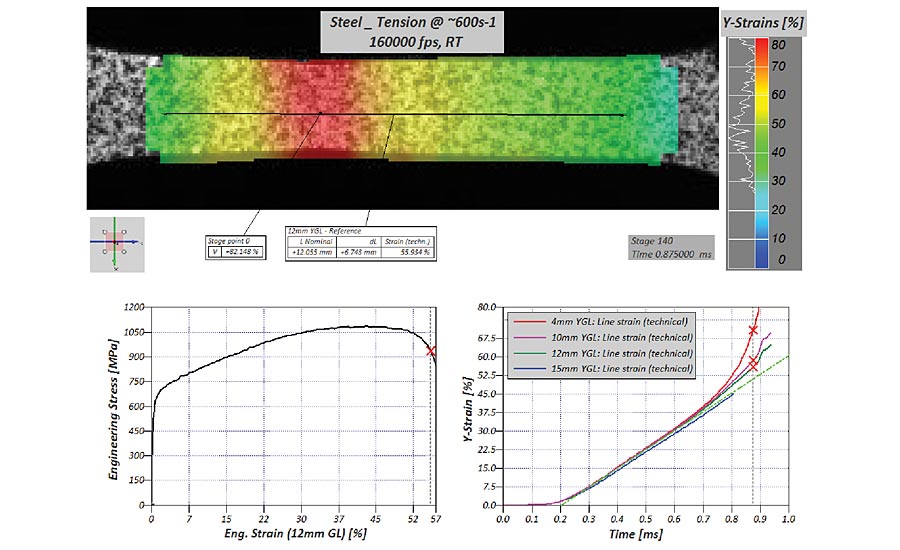
An example video of a high strain rate test (at ~750s-1) showing the ability of capturing material deformation with digital image correlation (DIC) and also the development of a relatively smooth stress/strain curve for the tested material.
Ultimately, we must see the big picture and how we have come to rely on today’s cars to transport us safely. Behind the scenes automotive manufacturers and material suppliers must constantly evaluate new materials on another level; a level that is “hidden” between the initial quality checks of incoming materials, and the final automobile crash tests. The data they obtain is used to engineer optimum car body structures with significant refinements and greater safety, all without the consumer noticing any difference. Q
Looking for a reprint of this article?
From high-res PDFs to custom plaques, order your copy today!


