Software & Analysis
Using Simple Linear Regression For Instrument Calibration?
Learn why orthogonal regression is a better approach.

Source: Adobe
Measurement devices must be calibrated regularly to ensure they perform their jobs properly. While calibration covers a wide range of applications and scenarios, the goal is simple: ensure your device is measuring to your standards. Most quality systems require a satisfactory measurement system, which includes formal, periodic, and documented calibration of all measuring instruments. A common problem that engineers face is how to verify that two instruments are measuring parts in a similar fashion.
How Do You Determine If Two Instruments Provide Comparable Measurements?
One approach is to compare the two instruments by fitting a simple linear regression line, and then use the model fit to see if the values are the same across the range of measurements. Simple linear regression models the linear relationship between two continuous variables: one response and one predictor.
Suppose there is a medical device manufacturer that wants to determine if their blood pressure monitor is equivalent to a similar model on the market. To verify that the two instruments provide comparable measurements, the manufacturer selects people that represent a range of values where the measurements need to be comparable. Then, they measured the people with both instruments. The company obtains systolic blood pressure readings on a random sample of 60 people using the two instruments and records the data. Shown are a sample of the 60 rows, where each row represents a measurement using the Current and New instruments.
DATA |
||
| Row | New | Current |
| 1 | 100 | 100 |
| 2 | 122 | 120 |
| 3 | 129 | 132 |
| 4 | 136 | 139 |
| 5 | 110 | 110 |
| 6 | 111 | 110 |
| 7 | 137 | 137 |
| 8 | 134 | 133 |
| 9 | 141 | 140 |
| 10 | 112 | 112 |
In this case we designate the Current readings as the predictor (or X) variable and the New readings as the response (or Y) variable. Fitting a regression line to this data shows that the Current measurement device readings predict the New measurement device readings quite well. The R-squared statistic indicates that the Current measurement device explains 98.8% of the variation observed in the New measurement device.
The regression equation is:
New = 1.387 + 0.9894 Current
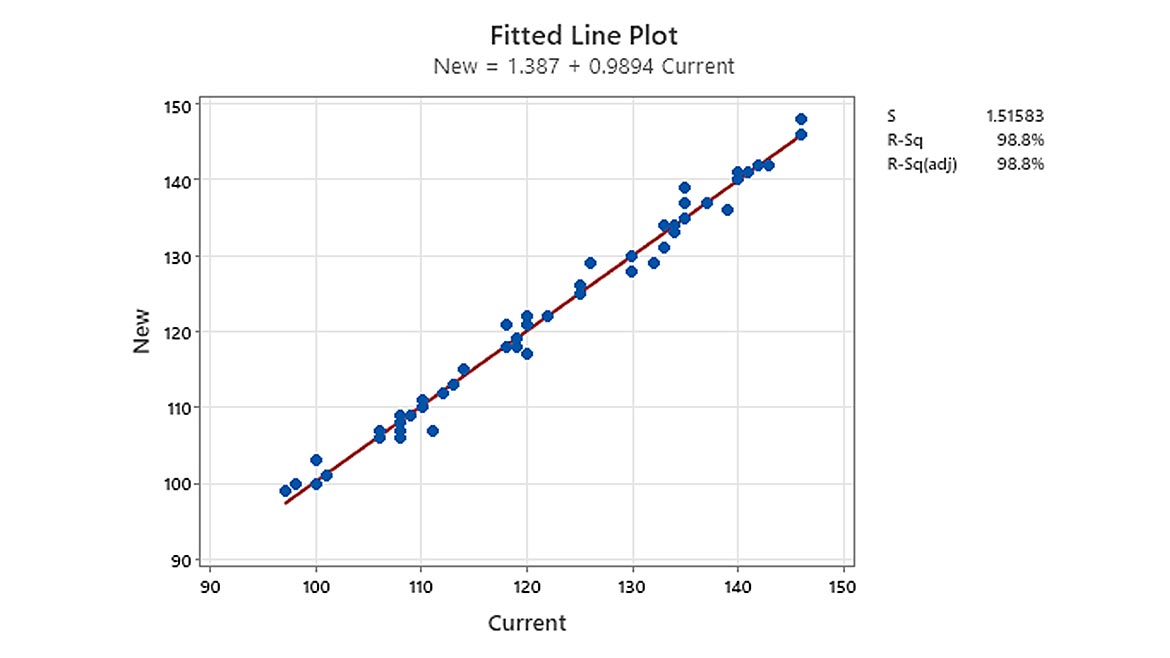
Fitted Line Plot (Click on image to enlarge.)
It appears from this data that the Current measurements can certainly predict the New measurements quite well. In practice, we see engineers use predictive models to confirm that a new device can measure as well as a current device. There are other applications as well; there are situations when a faster measurement is needed. For example, some parts or samples must be measured using laboratory measurements before they can be shipped. But laboratory measurements can take hours, depending on the process. A measurement method that provides immediate results can be used to predict the laboratory measurements, providing operators and engineers with immediate feedback of potential problems.
The simple linear regression approach is good when we can assume there are no errors in the horizontal, or X direction. For this example, this would imply that our current measurement system contains no error. In the case of measurement systems, we know that assumption is not reasonable—so using simple linear regression is not the best statistical approach. But no worries, there is another approach that is just as easy to use.
Orthogonal Regression
Orthogonal regression, also known as Deming regression, can be used to determine whether two instruments or methods provide comparable measurements. Orthogonal regression also examines the linear relationship between two continuous variables: one response (Y) and one predictor (X). Unlike simple linear regression (least squares regression), both the response and predictor in orthogonal regression contain measurement error. Recall that in simple regression, only the response variable contains measurement error. If you use simple regression to determine comparability when both variables contain measurement error, the results depend on which variable the calculations assume have no measurement error. Orthogonal regression addresses this problem, so the roles of the variables have little influence on the results.
In simple linear regression, the goal is to minimize the sum of the squared vertical distances between the y values and the corresponding values on the fitted line. In orthogonal regression the goal is to minimize the orthogonal (perpendicular) distances from the data points to the fitted line. While the difference between these approaches may seem minor, when evaluating measurements and parts relative to specifications, it could result in significantly different conclusions.
Let’s analyze the blood pressure monitor data using orthogonal regression.
Orthogonal regression requires that you specify the ratio of the variance of the error in X (Current) and Y (New). When the measurement method for X and Y is the same, the variances are likely to be equal, which would result in a ratio that equals 1. But it is good practice to estimate it. Prior to the data collection for the orthogonal regression, engineers did separate studies on each monitor to estimate measurement variation. The error variance ratio was calculated by performing an independent gage repeatability and reproducibility study for each measurement device to produce a variance component for repeatability for each device. The ratio of the two variance components for repeatability estimates can be used as the input for the error variance ratio field. The variance for the new monitor was 1.08. The variance for the other company’s monitor was 1.2. The engineer decides to assign the New monitor to be the response variable and the other company’s Current monitor to be the predictor variable. With these assignments, the error variance ratio is 1.08 / 1.2 = 0.9.
Orthogonal Regression Results
The fitted line plot shows that the points fall close to the regression line, which indicates that the model fits the data. Here we show the Least Squares fit and the orthogonal fit. The two fitted equations are seen in the bottom left of the visual.
The orthogonal regression equation is: New = 0.644 + 0.995 Current
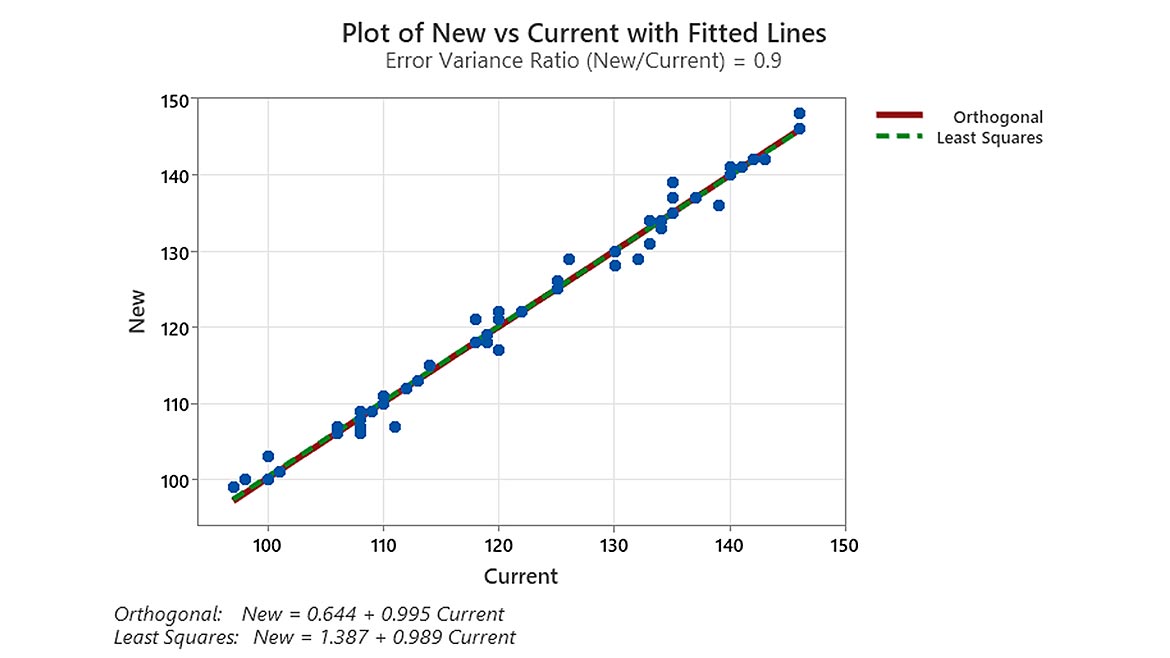
Plot of New vs Current with Fitted Lines. (Click on image to enlarge.)
Note that even though the lines appear very similar, the orthogonal regression equation is different from the simple linear regression equation. We can use the orthogonal regression equation to understand the equivalence of the two measurement instruments.
If either of the following conditions is true, the results provide evidence that the blood pressure monitors are not equivalent:
- The confidence interval for the slope does not contain 1.
- The confidence interval for the constant does not contain 0.
COEFFICIENTS |
|||||
| Predictor | Coef | SE Coef | Z | P | Approx 95% CI |
| Constant | 0.644 | 1.745 | 0.369 | 0.712 | (-2.775, 4.064) |
| Current | 0.995 | 0.014 | 70.346 | 0 | (0.968, 1.023) |
Usually, a confidence level of 95% works well. A 95% confidence level indicates that if you took 100 random samples from the population, the confidence intervals for approximately 95 of the samples would contain the true value of the coefficient. For a given set of data, a lower confidence level produces a narrower interval, and a higher confidence level produces a wider interval.
The results show that the confidence interval for the constant, which is from approximately -2.78 to 4.06, contains 0. The confidence interval for the slope, Current, which is from approximately 0.97 to 1.02, contains 1. These results do not provide evidence that the measurements from the monitors differ. Based on these results, the company can conclude their new measurement device performs as well as the current device on the market.
Conclusion
When calibrating two measurement systems, orthogonal regression can determine whether the instruments or methods provide comparable measurements. Unlike simple linear regression (also known as least squares regression), both the response and predictor in orthogonal regression contain measurement error. Using orthogonal regression, the medical device manufacturer can confidently conclude that their measurement instrument is equivalent to the current measurement instrument on the market today. You can find orthogonal regression in most statistical packages.
Looking for a reprint of this article?
From high-res PDFs to custom plaques, order your copy today!


