Software & Analysis
SPC Software Enables Real-Time Process Management
When the process is in-control, monitoring it using the SPC control chart ensures that it will reliably meet the process requirements.

All Images Source: Paul Keller/Quality America
A statistical process control (SPC) control chart is a key process management tool, providing indication if the process is predictable and consistently capable of meeting requirements.
When used in operations to monitor KPI (key process indicators), such as product dimensions on the production floor, the control chart provides real-time management of the process, with the potential to prevent out of specification as well as over-adjustment to the machine settings. The statistical control limits on the control chart provide the expected variation of the process parameter that is plotted (generally either a measured observation or the average of two or more observations): If the process is stable, the groups will plot between the statistical control limits. In this case, and only this case, the process is predictable, which is highly desirable from a process management perspective.
Once process control is established, the process can be evaluated for its capability to meet the requirements, usually expressed using upper and/or lower specifications. These specifications, sometimes referred to as the voice of the customer, should not be confused with the control limits on the SPC chart, which might be considered the voice of the process and are calculated based on the process data. The control limits for a stable process provide the expectations for the process, whereas the specifications define its requirements. A process is deemed capable when its expected variation meets these requirements.
When the process is in-control and capable, then monitoring the process using the SPC control chart ensures that the process remains stable and will reliably meet the process requirements, a critical process management concern. In addition to the statistical control limits, the control chart can also employ the use of Run Test Rules, which look for abnormal patterns of plotted groups within the control limits, providing increased sensitivity to detecting process changes. So long as the plotted groups remain within the control limits and do not violate the Run Test Rules, the real-time process management is simple: Make no adjustments to the process. Deming’s funnel experiments (outlined in his Out of the Crisis text) showed how, in the absence of control charts, process variability will increase substantially due to ill-advised adjustments to the process. The control chart’s control limits, as well as the run test rules, provide the best indicator of when process adjustments are necessary, preventing unnecessary adjustments to the process, which Deming referred to as process tampering. Figure 1 shows how tampering increases process variation.
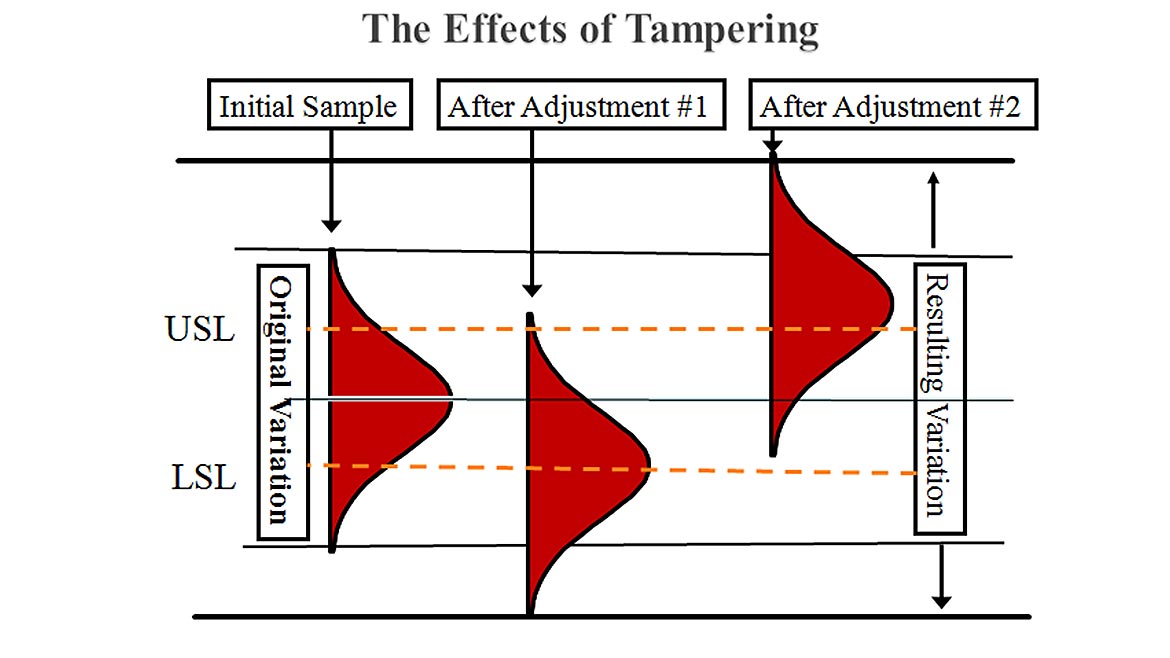
Figure 1: The Effects of Tampering (from Statistical Process Control Demystified by Paul Keller. McGraw-Hill 2011).
In modern facilities, SPC software is used to construct and update the control chart instantaneously, automatically checking the new data for any of the desired alert conditions, such as out of control, Run Test violations or out of specification. Many times, data from electronic measurement equipment such as micrometers, calipers, indicators, and scales can be sent from the measurement equipment through the computer’s USB port, so the data is recorded to the chart without the need for keyboard entry.
While many opportunities exist for digital input of measurement data to the software, manual entry of the data to SPC software can still provide efficient and effective means to monitor the process. When designed for use in production, SPC software will invariably use a built-in database so that the data entry personnel can quickly open the control charts for a specific part or process and begin keying in data with minimal lead time (i.e., no hunting for that Excel file). An easy-to-use interface is optimal, so production operators don’t feel as if valuable time is wasted in the data entry process. The interface should lead the operator simply through the data entry process, with built-in options underlying the interface to meet the varying requirements of different parts or scenarios, including:
Data Prefix: When entering measurements with multiple decimals, this option will preface the keyboard entry so that only the significant trailing digit need be entered by the operator. For example, set a data prefix to “3.456” and the operator need only enter “7” via the keyboard for an entered value of 3.4567.
Data Conversion: This refers to simple calculations done to convert the measured value into a different value. You may measure the parts in inches, but the customer prefers to see charts in metric units, for example.
Formula: In some cases, you need to track a computed value based on two or more measured parameters. For example, the operator will measure the Empty Weight and the Full Weight of a vessel, and the software calculates and plots the Fuel Weight. In this case, you often have specifications for each of the three parameters, so the ability to conveniently view and evaluate each of the charts is critical. In the example shown in Figure 2, buttons with each of the characteristic’s name are provided in the Data Entry form on the left side so the operator can easily switch between the three characteristics’ charts.
Measurement Order: In some cases, such as when a part is measured in a fixture or when measuring chemical samples, it’s easier for the operators to enter all the characteristics from one sample before proceeding to the next. In other cases, you may enter multiple samples for a single characteristic before moving to inspect the next characteristic.
Sampling Rates: Some characteristics may require more frequent samples.
Timed Sampling: This notifies the operator when a new sample is required based on preset time intervals.
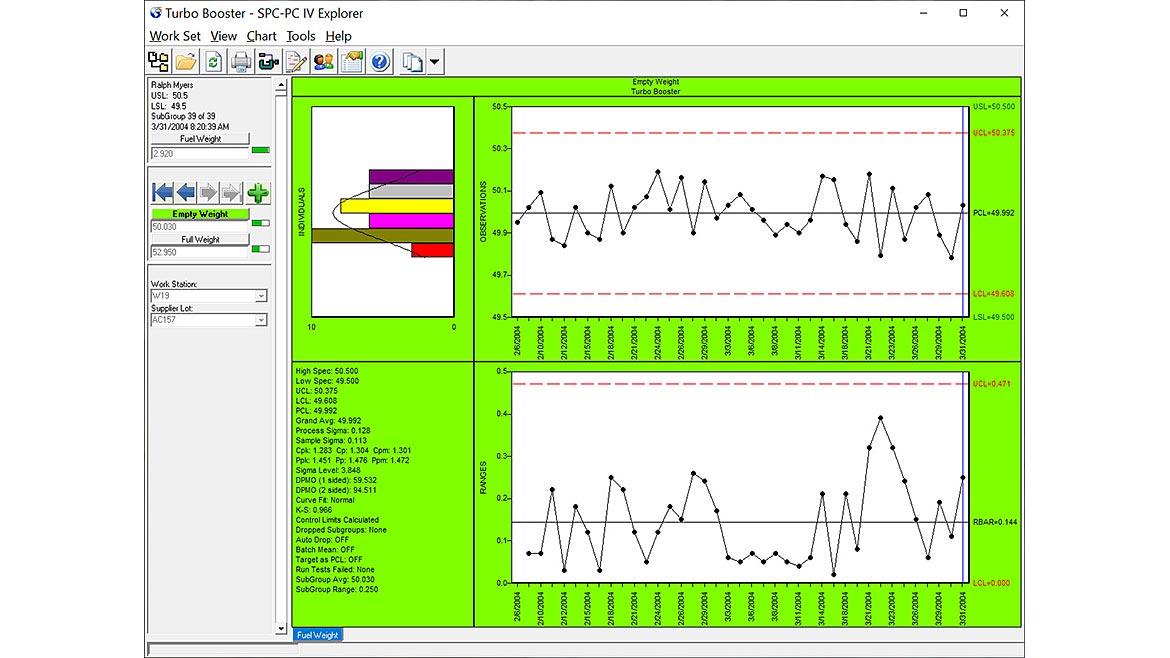
Figure 2: Example Formula Chart (from SPC-PC IV Explorer software by Quality America, Inc.)
In addition to the measurement data, data entry also includes select traceability fields, which provide reference for quick search of the database. Traceability as a best practice ensures that end-user product can be traced back through the production processes to the raw materials. While traceability is required in many regulated industries such as pharmaceutical production, it is a best practice in any quality management system that greatly improves the ability to respond to customer issues. As a simple example, data entry could include the job number used to track the production order internally, as well as the lot number of the raw material used. The job number could be tied to the customer’s purchase order (PO), so that if the customer references product received via that PO, you would then know the production job number and the raw material lot number. While searching through a paper-based system for the relevant data records is painstakingly difficult, searching through your electronic SPC database is pleasantly simple. You can quickly filter the process data, so the chart and subsequent exported reports include only the relevant job number(s). The control chart provides the necessary link to correlate the reported customer issue to the internal process data. Likewise, Pareto analysis on the various traceability fields, particularly the assignable cause and corrective action fields used to document process remedies, may provide meaningful insight, as shown in Figure 3. (See also Control Chart Analysis: An Example from February 2021 and How to Statistically Control the Process from April 2019 for example analyses).
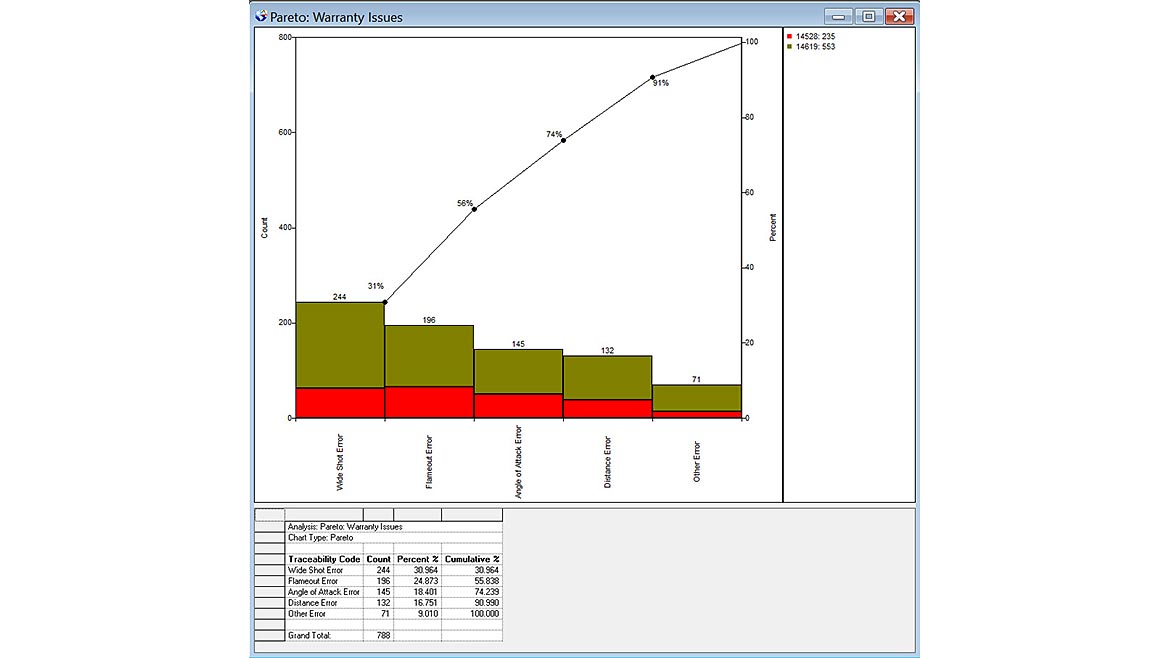
Figure 3: Example Pareto Analysis (from SPC-PC IV Explorer software by Quality America, Inc.)
A key component of the process management aspect of the control chart is the immediate feedback to the process operator to confirm the process stability and conformance to specifications. If process instability or an out of specification condition is detected, then SPC software can prompt the data entry personnel with suggested troubleshooting remedies, as well as required fields for documenting their immediate assignable cause and corrective action. Emails and/or text messages can be automatically sent to support engineers and production management to further a communal response to the issue, where needed.
When the process data is available electronically, such as via a text file output of a CMM, then the SPC chart can be automatically linked to this external data source. Data entry as described above is not required, and the control chart is automatically refreshed with the new data. In that case, a process monitor dashboard display is often useful, providing a quick view of all your current KPI, such as shown in Figure 4. Each of the items has an underlying control chart that can be accessed by double-clicking the item in the list. When alert conditions are encountered, the process monitor item changes from green to red, and alert notification emails sent. In this scenario, you can also set the software so these analyses and alert notifications can be completely automated, updating continuously without any intervention required. When alert conditions are investigated, the charts can be updated with the resulting assignable cause and corrective actions for later review and analysis.
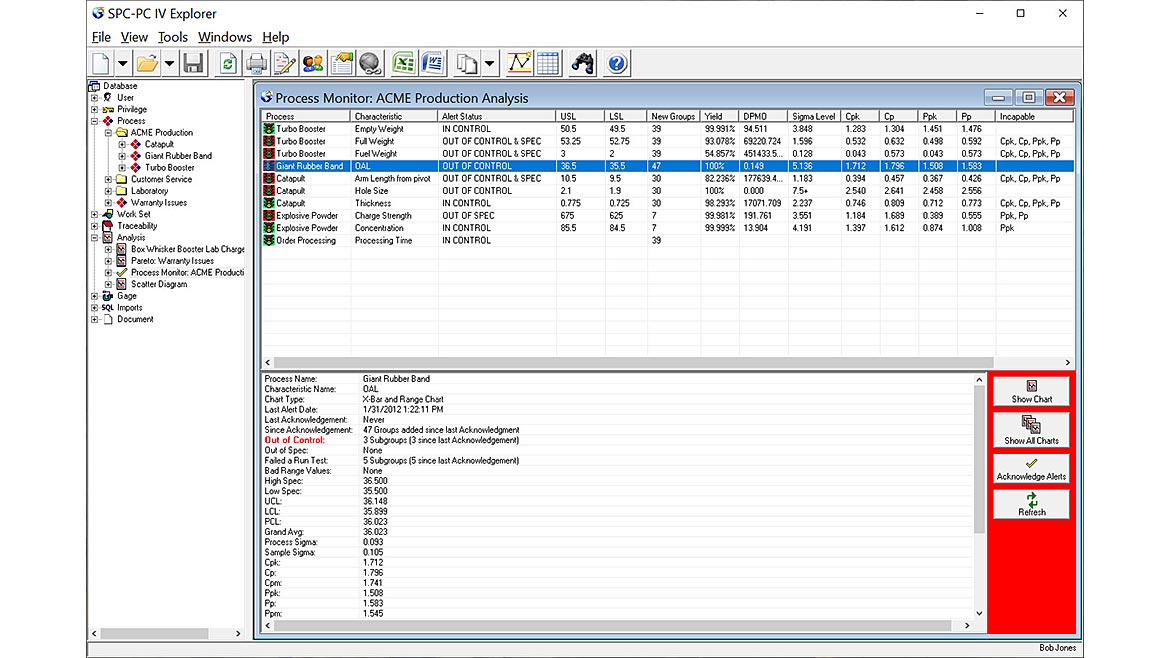
Figure 4: Example Process Monitor Chart (from SPC-PC IV Explorer software by Quality America, Inc.)
Real-time process management using SPC software has never been more cost-effective, providing substantial benefits by consistently meeting customer requirements with minimal labor expense.
Looking for a reprint of this article?
From high-res PDFs to custom plaques, order your copy today!


