Prevention is the Key to Reduced Quality Costs
Customer-facing processes must be designed to prevent errors and minimize cost of failure.
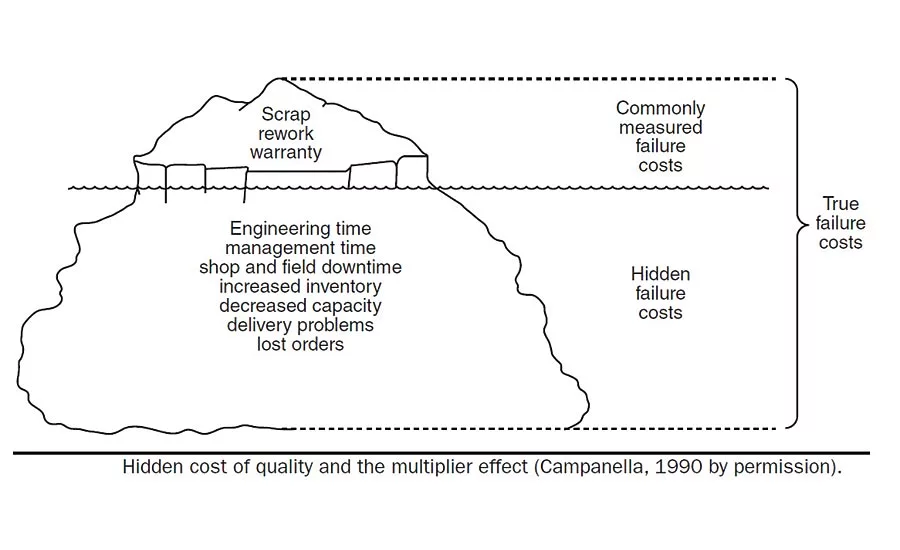
Figure 1. This shows how hidden failure costs dominate the more obvious costs of failure.
Quality professionals see many costs of quality firsthand. These include our salaries and benefits, the equipment used to measure and analyze quality outcomes, and the waste generated by these processes when they fail to meet requirements. Naturally, many quality cost systems are heavily focused on internal issues, since those are most readily visible to the quality professional. These issues may slow production, forcing rapid response and quick remedy. These issues can quickly become high profile within the organization, particularly in lean and build-to-order systems with minimal inventory to take up the slack in delivery. Quantifying these costs is not trivial, but fairly straightforward nonetheless with minimal assumptions.
Traditional quality systems, circa 1950, relied heavily on inspection and audit functions to detect problems. In these systems, production personnel were strictly responsible for getting product out the door, and the quality personnel served as the gatekeeper to detect issues at two critical points in the process: when product entered the facility from the supplier and when product left the facility post-production.
Fortunately, many organizations heeded W. Edwards Deming’s teachings in the 1980s, recognizing the failings of these limited systems, to direct more attention towards prevention and systems analysis. Quality systems were designed to prevent, rather than just detect, issues using tools such as: failure modes and effects analysis (FMEA), which can steer us towards preventing the more critical issues; Poka Yoke or mistake proofing to ensure processes are designed to prevent errors, typically human errors in setup; and statistical process control (SPC) to determine if the process is inherently capable of producing product within the requirements. SPC control charts used by production personnel to verify the process output as it was being generated served to prevent external failures and minimize cost.
While inspections by production personnel still count towards cost of quality expenses, the virtue of the in-process SPC control chart allows smaller samples than would be needed post-production, reducing the overall cost of inspection. Furthermore, a still larger benefit in reducing cost of quality is provided by the earlier detection of process issues, which prevents additional waste (i.e. cost of failure) from this process, as well as that incurred from downstream processing of product unsuitable for customer use. Figure 1 shows how hidden failure costs dominate the more obvious costs of failure. In addition, as Deming noted, in the absence of control charts, production personnel often over-adjust processes. This tampering just as easily leads to increased process variation (and defects) as failing to adjust a drifting process. See Figure 2.
As Deming’s methods became more popularized throughout the 1980s, prominent companies in the aerospace and automotive industries compelled their suppliers to implement more preventative quality systems. The high sampling rates required for incoming inspection protocols, prevalent in ‘50s-era inspection/audit-focused quality programs, were far more costly yet less effective than in-process SPC at their supplier. Philip Crosby turned the phrase “Quality is Free” into a mantra, and he was not alone in noting that minimizing variation in upstream supplier processes provided significant cost benefits for the entire supply chain to the end customer. Juran’s Optimum Quality Cost model (Juran, 1988) shown in Figure 3 demonstrates the relationship between quality levels and quality cost: Quality levels improve, and total quality costs decline, as failure costs decline, but at the cost of increased appraisal and prevention costs. Quality is not quite free, but its cost is minimized by investing in prevention to reduce failure. Expensive inspections of supplier materials pre-production and product going to the customer post-production must be replaced with in-process systems to prevent waste as much as possible, and to detect waste as soon as it occurs.
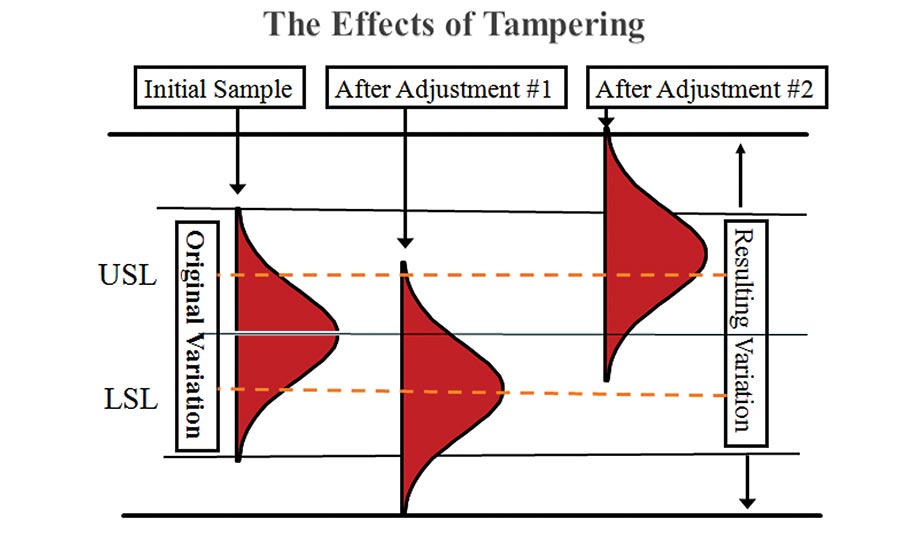
Figure 2. As Deming noted, in the absence of control charts, production personnel often over-adjust processes. This tampering just as easily leads to increased process variation (and defects) as failing to adjust a drifting process.
This is a foundation of lean, although there are countless under-performing lean implementations that have failed to grasp that critical requirement: You cannot possibly implement an efficient just-in-time level-loaded production system unless your processes are predictable (i.e. in statistical control) and you can rapidly provide real-time feedback of process disruptions at critical points in the production processes. SPC charts applied internally to these processes provide the statistical control and rapid feedback needed as a precursor to reduced inventories and JIT deliveries.
Nowadays, with an eye towards further reducing cost and improving efficiency, SPC charts used in production are often automated using electronic data entry, minimizing the disruptions to the production-focused activities. Alerts are automatically generated via email to engineers and managers when process disruptions are identified, including process shifts, trends within the control limits (i.e. run test violations) or out of spec parts, fostering an all-hands-on-deck response. When production equipment is highly repeatable, such as in CNC machining and injection molding, the inspections might be limited to first article inspection of the setup. (Here also, SPC charts are useful to ensure the setups are within the historical consistency of the process to minimize disruptions to (internal and external) customer processes.)
Customer focus necessarily expands the quality mission. A full value-stream analysis of a product or service will apply these methods to our customer-facing processes, and even the external processes used within our customers’ operations. This focus on the entire customer experience more clearly matches the customer expectations. When customers consider the quality of a given product, they often go beyond the physical product attributes (the focus of most internal quality systems) to include delivery, ease of use and support. My smart phone provides outstanding reliability through the quality of its components. Indeed, its ability to store a lifetime of music, take countless videos and pictures of friends and family, and call, text or email instantaneously worldwide is simply remarkable. It never stops working due to a component failure. Yet, if you’re within earshot, you’d regularly hear me curse its ease of use or lack of battery life. The overall quality is diminished by these more subtle interactions. Impression is everything; the overall experience is paramount; perception is fact.
The Wall Street Journal recently reported how companies are now using technological solutions to track the so-called breakpoint of its customers (Wall Street Journal, April 3, 2019. Everyone Hates Customer Service. This is Why). The article cites numerous examples of companies analyzing customer service data to predict how long customers will remain engaged in finding a solution to their issue before giving up and going to a competitor. Some call centers used software to monitor voice inflection and tone to route calls real-time to more skilled technicians. Most of these call centers employed third-party vendors to handle their support, often located in countries where wage costs were lower. While these methods may reduce the immediate costs of support, they will increase the total cost to the customer, which impacts future sales and growth in a competitive market. The cost of implementing these types of solutions are better allocated to improvement of the core business product and service.
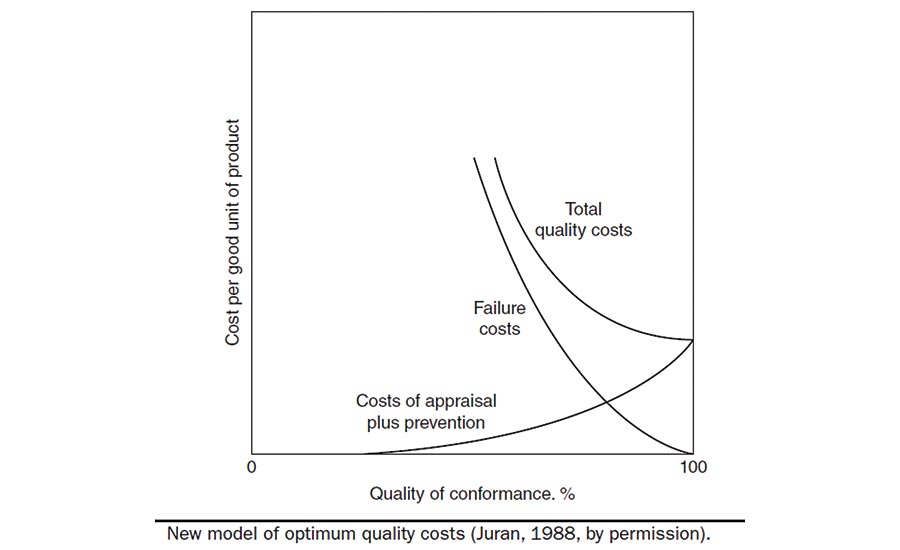
Figure 3. Juran’s Optimum Quality Cost model (Juran, 1988) shown here demonstrates the relationship between quality levels and quality cost:
Here again, prevention is the key to reduced quality costs. Customer-facing processes, including customer support call centers and web pages, must be designed to prevent errors and minimize cost of failure. Failure in this context includes time wasted by customers in seeking support, in addition to the issue causing them to seek support in the first place. Support systems must be designed so they are readily available to the customer, with accurate information provided to quickly resolve the issue. The customer support process should be analyzed for waste and process capability, typically by monitoring the time to initial response and overall time to resolution.
While improvement efforts relative to time to initial response should be focused on minimizing the time, caution should be exercised in analyzing and improving the total time to resolution. If support staff are judged based on the time to resolution, they will likely rush responses rather than provide more accurate responses that can take longer. The emphasis should remain on providing both rapid and accurate responses to the customer, requiring systems that educate the support personnel and provide them the tools they need to respond to issues, including troubleshooting tools, product information, customer details, order details, etc. Routing certain calls to more experienced support staff may be acceptable, but only if this can be done expeditiously. Constant monitoring of the issues requiring support, such as through Pareto analysis and control charts, provide feedback to the quality analyst that should be incorporated into the product design, delivery and/or service processes to prevent the issue as far up the supply chain as feasible.
Quality costs. Lack of quality costs. Balancing these costs is an existential challenge for every business.
Looking for a reprint of this article?
From high-res PDFs to custom plaques, order your copy today!


