Quality Software & Analysis: Go With the Flow
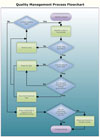
A
flowchart describes a quality improvement process. Source: SmartDraw.com
As flowcharting or process mapping has evolved to a new level of sophistication, the question remains: How can new flowcharting capabilities help quality control (QC) professionals do their jobs more efficiently? That is the goal all software developers and users must keep in mind. And, because consistency is such an important aspect of quality control, the importance of flowcharting cannot be underestimated. A flowchart must provide a standard that facilitates process improvement.
“A flowchart is so much more than just a graphical representation,” says Bill Patton, president of Patton & Patton Software Corp. (Oro Valley, AZ). “It is the only device that can communicate an intricate process between different levels of knowledge, training and abilities. The engineer can wave his hands all day but cannot explain technical specifications to an assembler; the business owner can wave and rant but cannot get someone to assemble, test and build the newest mouse trap for him. Flowcharts can solve these delicate situations. For example, an owner can use flowcharts to hire and train engineers on what it is he is trying to conceive.”
Terry Schurter, chief information officer of BPM Group (Burlington, MA), a consulting firm, agrees that making the QC professional’s job easier is the key to process mapping. “Does flowcharting make the customer’s life easier? If we cannot answer that question with a yes, there is no point in going there. Flowcharting software should be useable out of the box, just open and go. The best products require the least amount of thinking by the user, and that keeps the focus on the business problem. Once things start getting complicated, value creation nosedives.”
Reviewing the basic definition of process mapping puts all new developments in perspective. Process mapping is a technique that identifies the world of a process. It shows all of the inputs, such as subassemblies and materials, machining processes and machine operators-basically anything that happens inside a process-and all of the outputs of that process, including the finished product or the individual manufacturing or handling steps along the production line. By viewing the route that the finished product takes along the process map, quality personnel can determine where potential problems lie, rather than catch them during final inspection.
These four principles are the basis for successful flowcharting development and application.
- Process mapping shows the route that a finished product takes.
- Knowledge is the key; extensive information gathering should be conducted beforehand.
- Inputs and outputs tell where to search for answers to production problems.
- Layered flowcharts of each individual process narrow the possibilities for error.
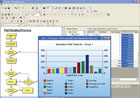
Flowcharts
are a way to visualize processes and identify improvement opportunities.
Source: Proquis
New Flowcharting Capabilities
According to Paul Stannard, CEO of SmartDraw.com (San Diego), the latest process mapping software offers the following features.- Nondestructive editing. The ability to modify a flowchart without disrupting the rest of the chart.
- Data-driven flowcharting. The ability to import and export outside services.
- Drag-and-drop. Standardized symbol sets can be easily added to a chart.
- Increased emphasis on style. More colors, styles and special effects can be applied to a chart.
- Stamping. The ability to stamp new shapes on a flowchart rather than drag and drop.
- A flowchart must provide a standard that facilitates process improvement.
- By viewing the route that the finished product takes along the process map, quality personnel can determine where potential problems lie, rather than catch them during final inspection.
- Readable fonts such as Trebuchet or Verdana should be used, as well as muted colors and effects.
Improved guidelines and communications are keys to new developments. “Most new drawing applications have the ability to drag guidelines out, making it much easier to keep a flowchart lined up and easy to read,” Stannard notes. “Perhaps the most important feature for any drawing application is its ability to be shared. With PDF becoming the de facto document format that can be read by anyone, an increasing number of drawing applications support export to PDF.”
Simplification, not simplicity is the goal to developing flowcharts, Stannard continues. “Often, a flowchart is made too simple, and information is lost or the chart is difficult to understand. However, a flowchart that uses standard symbols and notation can simplify a verbose outline or paragraph of text,” he says. Also, there are no general design rules that cover flowchart creation. Instead, the design depends on the purpose of the flowchart. “In the context of quality control, the focus is on the content and communication. You do not want bright colors distracting a busy employee from getting the information he needs. Readable fonts such as Trebuchet or Verdana should be used, as well as muted colors and effects.”
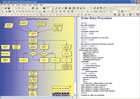
Some
flowcharting software has text-to-graphics capability that allows the
user to drag-and-drop boxes and clusters, or simply type text in the right-hand
column, which is automatically inserted into the boxes. Source: Proquis
“Most process mapping and flowcharting tools are drawing packages, in which the operator draws links between the boxes. It takes time to learn these systems,” explains Bill Best, Proquis president. “We’ve moved away from drawing packages that merely allow the user to drop boxes, and then write the text inside. Our program takes the text document and converts the text into a process map. As quickly as one can type the text for the boxes, the diagram is drawn. The user just describes the process and the system creates a process map.” The program is a real time-saver for QC professionals who, for the most part, are not experts in computer graphics, says Best.
Future Directions
Any discussion on the future of flowcharting should cover topics such as process improvement and systems integration. Following are some thoughts from experts in the field.Can flowcharts identify opportunities for process improvement?
Stannard: Yes. In fact, SmartDraw.com advocates an approach called IDOC, which stands for identify, diagram, optimize and communicate. 1) Identify which process or processes you want to improve. 2) Diagram the process using a flowchart or other business graphic. 3) Optimize the process by using the flowchart to identify opportunities for process improvement. 4) Communicate the results and findings with employees, management and key stakeholders.
Best: Yes. Flowcharts are a great way to visualize processes and, thus, identify improvement opportunities. The practical question, though, is, “How easily can we identify improvement opportunities?”
Schurter: Including process diagnostics in flowcharts creates a new level of process improvement opportunities. In many ways, this advanced concept is the holy grail for flowcharting, as it provides a degree of visibility into the places each process really needs to be improved, which can immediately be shared with anyone in the organization. With the ability to export process snapshots, flowcharts also can serve as a living history of process evolution to help gauge progress and set goals for future improvement.
What is happening with systems integration? Is Web-based old school?
Stannard: Web-based applications are somewhat old-school and are not really practical for most applications. However, the power of the Web, and the volume of information available on the Web is being increasingly used for systems integration and data acquisition. Web services, such as Google’s Map API, allow C-based applications to access information on the Internet, without sacrificing performance.
Best: Web-based is not old school; it will stay with us, even expand. However, integration via XML and other standardized data transfer and integration formats will be the way forward. It will allow data to be read from SQL and other databases, converting them into real-time representations of activity and processes. This will aid process analysis.
Can flowcharts serve as a programming interface to business?
Stannard: Flowcharts can be used to communicate requirements at a business level, which can then be used by IT to develop detailed design documentation.
Best: Any good programmer should work from a flowchart. Mapping out the program helps identify problems and ensures that the basic program will be optimized. The speed with which the process can be mapped is a key factor.
Schurter: People use process charts for this purpose but the real question is, should they? Process diagrams are an abstract representation of the “stuff” organizations do. Therefore, creating a flowchart that can be handed-off to someone else is not beneficial to the organization; however, creating a chart that communicates the purpose of the process and its real world character is beneficial; it prompts others to take action that is directly aligned with business goals.
How will flowcharting software evolve in the future?
Stannard: Data integration and on-the-fly data manipulation are on the horizon. Another major development will be the ability to take a single unique data set-such as an Excel chart-and change how it is presented with just one click.
Best: The idea of drag-and-drop will continue to be popular. However, the benefit of a program that can read and understand data and text, providing it as a visual flowchart automatically, will be an increasingly important feature in business areas where time is a key issue.
Schurter: Flowcharts will become more expressive, easier to use and eventually more interactive. It will be interesting to see if the market finds its sweet spot, where it grows to serve a broader set of organizational needs. Avoiding the black hole of complexity is the key to success.
In the quest to improve flowcharting capabilities, Patton stresses the importance of remembering the basics and the needs of the end user. “Many people want flowcharting software to be automatic,” he notes. “They want the computer to sniff out all of their processes and draw a chart to this effect, then publish it in neon lights. It’s kind of like quality: If you assign the task to someone lesser, the task does in fact become lesser. Quality is not over there; it’s right here, inside me, and that’s where the ability to flowchart comes from-from inside the individual who has a thorough knowledge of the process.” Q
For more information about the companies mentioned in this article, visit their Web sites:
BPM Group, www.bpmg.org
Patton & Patton Software Corp., www.patton-patton.com
Proquis Inc., www.proquis.com
SmartDraw.com, www.smartdraw.com
Tech tips
Looking for a reprint of this article?
From high-res PDFs to custom plaques, order your copy today!


