Back to Basics: Alloy Analysis with X-ray Spectrometry

Above: Figure 1. Accuracy overview from 0 to 100 weight percent comparison of certified and measured values for eight elements in the wide variety of CRMs listed in Table 4. Source: PANalytical B.V.
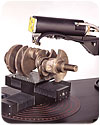
Alloy identification and analysis is an essential aspect of numerous industrial applications, ranging from scrap metal recycling to the manufacture of special steels for aircraft engines. X-ray fluorescence (XRF) spectrometry is one method that can be used for alloy analysis. The advantages of XRF have established the technique as an industry standard.
The importance of alloy analysis cannot be overestimated. Many alloys are similar in appearance and, therefore, can be easily confused after identifying labels, such as mill test reports, have been removed. Errors can have major cost implications-product failure, machine downtime and loss of consumer confidence all being possible consequences.
Above: Figure 2. Accuracy overview from 0 to 1.0 weight percent comparison of certified and measured values for eight elements in the wide variety of CRMs listed in Table 4. Source: PANalytical B.V
The challenges of analyzing a large variety of alloying elements with wide ranges of concentrations by XRF are well known to the metals industry, in particular the matrix corrections needed and the large number of reference materials required for high-quality results.

Figure 3. Master calibration plots for Ni. Source: PANalytical B.V.
WDXRF Analysis of Alloys
The data presented here demonstrate the use of a wavelength dispersive X-ray fluorescence (WDXRF) instrument, together with a package for the analysis of alloying elements with wide concentration ranges (See Figures 1 and 2).
Figure 4. Master calibration plots for Co. Source: PANalytical B.V.

Figure 5. Master calibration plots for Si. Source: PANalytical B.V.
Preparation of Standards and Samples
Calibration standards (CRMs), setup samples and the CRMs used to verify accuracy were resurfaced using a fine-surface milling machine with 150 grit Al2O3 paper. For the harder alloys, initial resurfacing required 80 grit ZrO2 paper.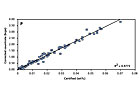
Figure 6. Master calibration plots P. Source: PANalytical B.V.
Measurement Conditions
Total measurement time was 470 seconds, with the spectrometer operated at 2.4 kilowatts. The program includes measurements on both peak and background positions for 21 elements and ensures accuracy at low concentrations.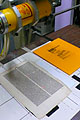
Figure 7: Short-term and long-term repeatability results for Al in a Nimonic alloy CRM (SS 310/1). The dashed lines indicate the 3-σ levels. Source: PANalytical B.V.
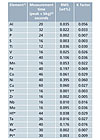
Table 1: Calibration data for the master calibration. Source: PANalytical B.V.
Master Calibration
The setup samples were calibrated against master calibrations containing up to 126 CRMs. Master calibration accuracies are shown in Table 1, where lower Root Mean Square (RMS) and K-factor values indicate more accurate calibrations (Figures 3-6 are calibration plots for Ni, Co, Si and P). Typical compositions for the setup samples are shown in Table 2.The FP model automatically calculates the matrix correction for the calibrations. The wide range calibrations shown in Figures 3-6 demonstrate the power of the FP model. Corrections for inter-element effects are optimized for each standard, making it possible to calibrate concentration ranges from 0 to 70 weight percent or more.
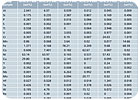
Table 2: Typical concentration values for the setup samples. Each set has a unique identification number (-xxx) because the concentration values may vary from one set to another. Source: PANalytical B.V.
Accuracy
The accuracy of the WDXRF instrument when used in conjunction with the setup samples is illustrated in accuracy overview plots for 11 elements, which compare certified and measured values for 12 CRMs of widely varying compositions (See Table 3).
Table 3: Analytical accuracy: comparison of certified and measured values for 18 elements in 12 CRMs of various types. Data for Y, Hf, Re and Pt are not included in this table because no reference values are available for these CRMs. Source: PANalytical B.V.
Precision and Stability
Precision was determined by repeated measurement of a Nimonic alloy CRM against the calibration. The CRM was analyzed 20 times consecutively for a short-term precision test and 15 times over three weeks for long-term data (See Table 4, Figure 7).Comparison of the RMS value (1s) with the Counting Statistical Error (CSE) shows both the precision of the method and the stability of the spectrometer. The similar magnitude of the RMS and CSE values shows that errors originating from the instrument are negligible.
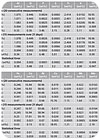
Table 4: Analytical precision derived from repeated measurement of a Nimonic alloy (SS 310/1). Source: PANalytical B.V.
The data shown here demonstrate that a WDXRF instrument offers a solution for the analysis of Ni-, Co- and Fe-based alloys, super alloys and steels in a single, wide-range analytical program. Analyses are accurate and precise, with excellent system stability.
Looking for a reprint of this article?
From high-res PDFs to custom plaques, order your copy today!


