17th Annual State of the Profession Survey
The State of the Profession is Strong
Quality professionals remain satisfied with their work, according to our 17th Annual State of the Profession Survey.

primary business/industry
Resources Expected to Increase
Region
AGE
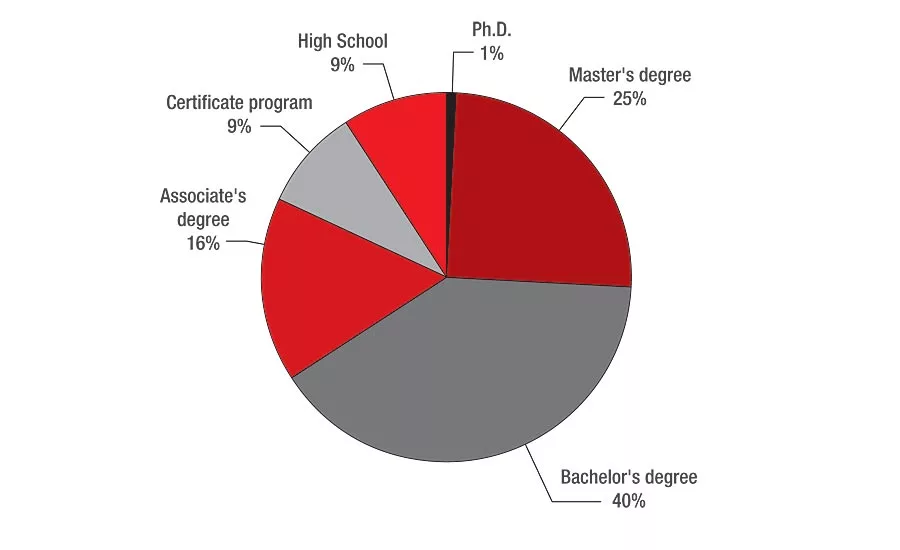
Education
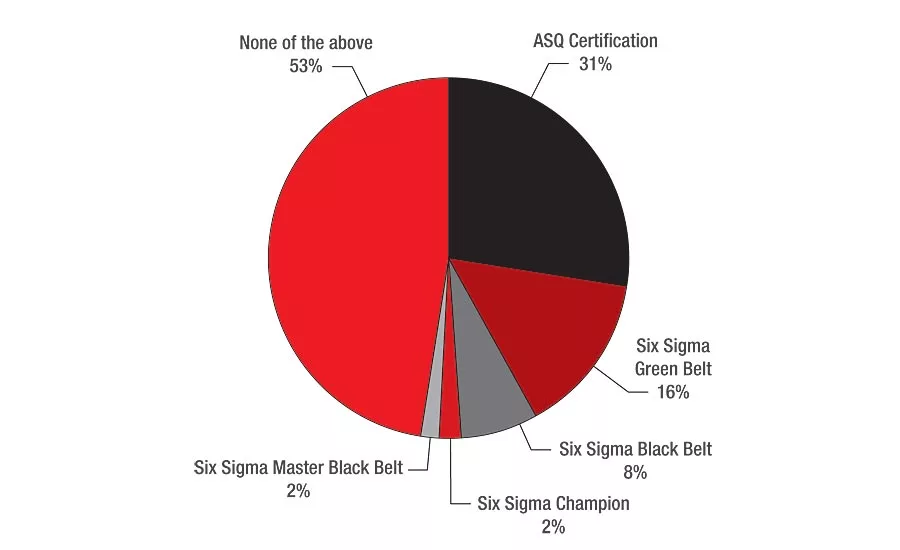
Designations Held
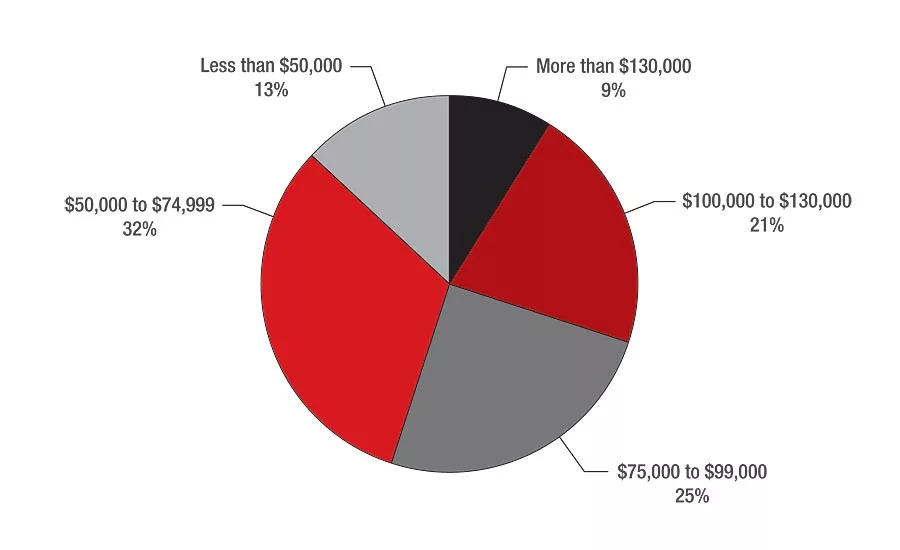
Annual Salary
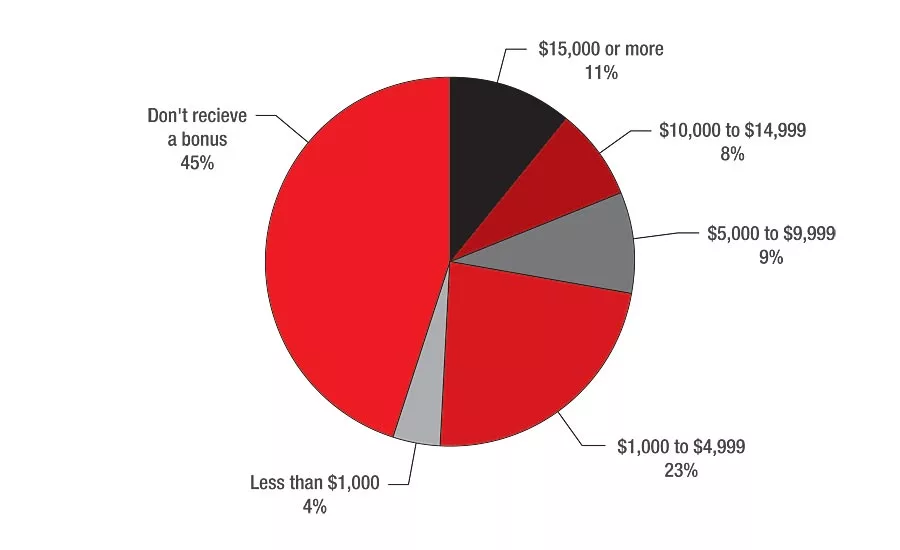
Annual Bonus
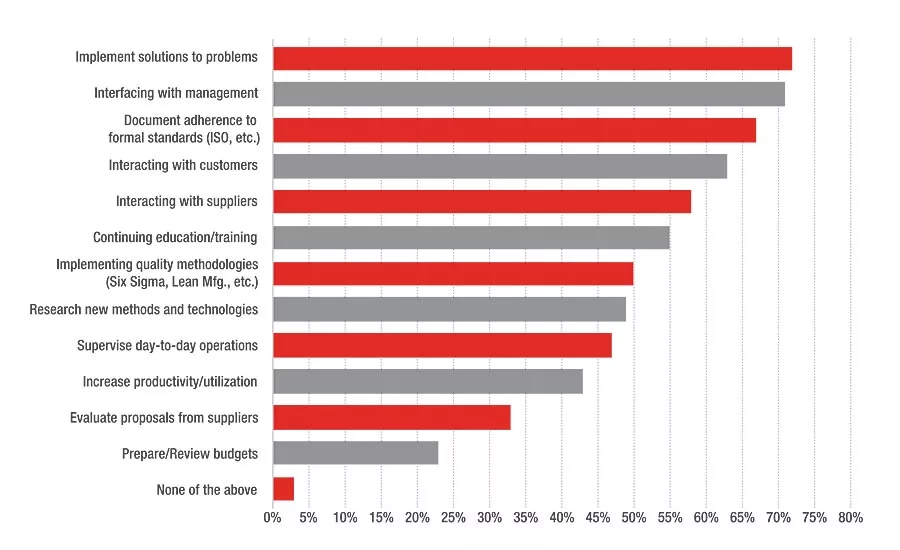
Quality-Related Responsibilities
If you’re curious about what your colleagues are doing, now’s your chance to find out. How does your position compare to others in the industry? What do your peers think of their work? And exactly how much are they making?
Quality professionals are extremely satisfied with their work, and the state of the quality profession remains strong, according to our 17th Annual State of the Profession Survey.
BNP Media’s Market Research division, in conjunction with Quality, conducts the survey to provide detailed information about professionals in the quality field. The survey aims to identify trends in employee compensation, work hours, job constraints, overall job satisfaction, quality improvements, and the quality demographic profile. Simply put, the survey is conducted to learn more about those in the field.
Respondents came from a broad cross section of industries, from fabricated metal products to medical to aerospace. Read on to learn more about your colleagues in quality.
A Company Portrait
Tech Tips
- Overall, 98% of respondents said they were involved in the purchasing process.
- The spending outlook looks stable for the next twelve months. About half plan to devote the same amount of resources, 36% plan to add resources, and only 13% anticipate fewer resources.
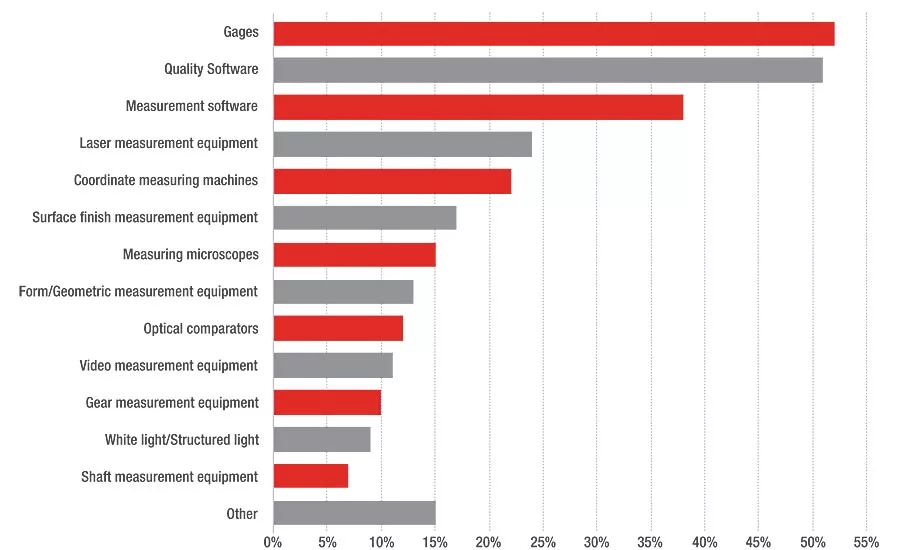
- The top resources they plan to invest in include gages (52%), quality software (51%) and measurement software (38%).
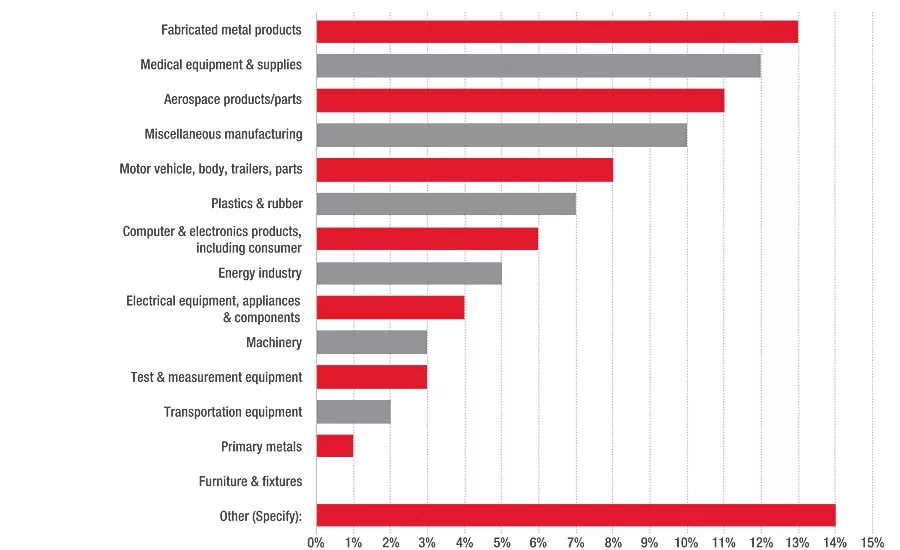
Respondents work in a variety of industries, with fabricated metal products and medical equipment and supplies coming in at the top, at 13% and 12%. This was followed by aerospace products at 11%, then miscellaneous manufacturing at 10%, followed by single-digit percentages for motor vehicle, body, trailers and parts; plastics and rubber; computer and electronics products; electrical equipment, appliances and components; energy industry; machinery; test and measurement equipment; transportation equipment; and primary metals. Nearly two-fifths of respondents (38%) work for OEM companies, more than a quarter (30%) are employed by components and parts manufacturers, and 12% work at a job shop. The remaining 20% didn’t fit into these categories and worked in other areas such as consulting or distribution.
Company revenue is healthy, with more than a quarter of respondents’ companies with annual revenues between $10 and $49.9 million. The median company revenue is $20 million. Company size was a mean of 5,651 employees and a median of 150. About half (46%) of respondents said their company size remained the same during the past year, and 36% said it increased. Only 18% said the company size decreased.
Overall, 98% of respondents said they were involved in the purchasing process. This included determining the need, approving purchases, recommending or evaluating brands, placing orders, and developing product specifications. In terms of purchases, the quality control group is primarily responsible for purchasing (42%), followed by executive management (22%) and purchasing (10%).
And the spending outlook looks stable for the next twelve months. About half (51%) plan to devote the same amount of resources, 36% plan to add resources, and only 13% anticipate fewer resources. The top resources they have in mind include gages (52%), quality software (51%) and measurement software (38%). Other items referenced include laser measurement equipment, coordinate measuring machines (CMMs), surface finish measurement equipment, measuring microscopes, form/geometric measurement equipment, optical comparators, video measurement equipment, gear measurement equipment, white light/structured light, and shaft measurement equipment. Fifteen percent said they were interested in increasing resources that were not listed here.
In terms of technology adoption, 14% said they are willing to be on the leading edge; 31% said they were willing to be one of the early leaders; 38% would wait until others successfully use it; and 17% said they would likely be one of the last to use it.
Manufacturing Locations
More than half (56%) of respondents have production only in the United States. After the U.S., Mexico (26%) and China (25%) were the most common areas for production. The average number of countries with production locations was three. Other countries listed included Germany (16%), India (14%), Canada and the United Kingdom (both at 11%). Next on the list was Brazil (10%), followed by single-digit percentages for France, Italy, Japan, Taiwan, Australia and Russia. Respondents also cited production in other countries in Europe, South America, the Middle East, Africa and Central America.
In terms of reshoring, or bringing operations back to the U.S., 84% reported no current or future plans to do so. Ten percent said they currently are reshoring, and plan to do so in the future.
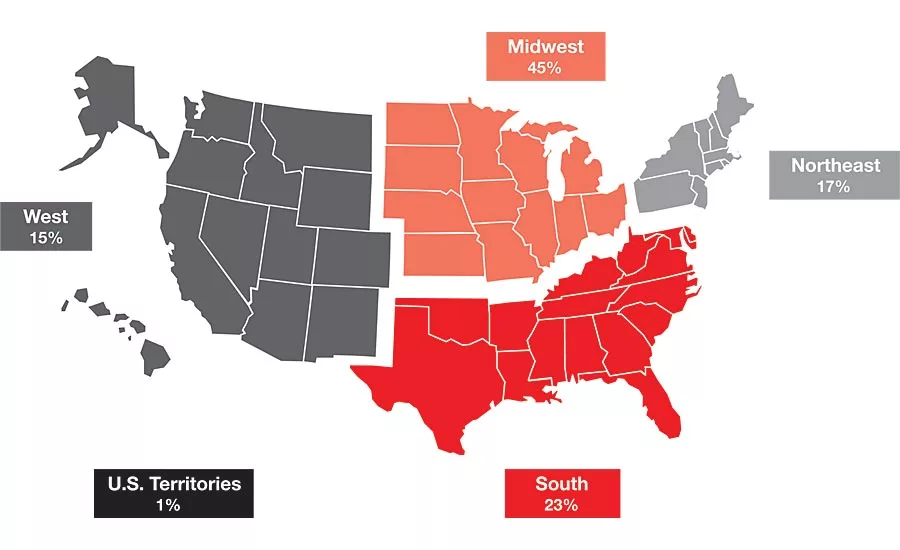
The majority of respondents came from the Midwest (45%), followed by the South (23%), the Northeast (17%) and the West (15%). One percent came from U.S. Territories.
Respondent Profile
The survey respondents are a highly educated group: 40% have a bachelor’s degree, 25% a master’s degree, and 1% are armed with a Ph.D. In addition, 31% have an ASQ certification.
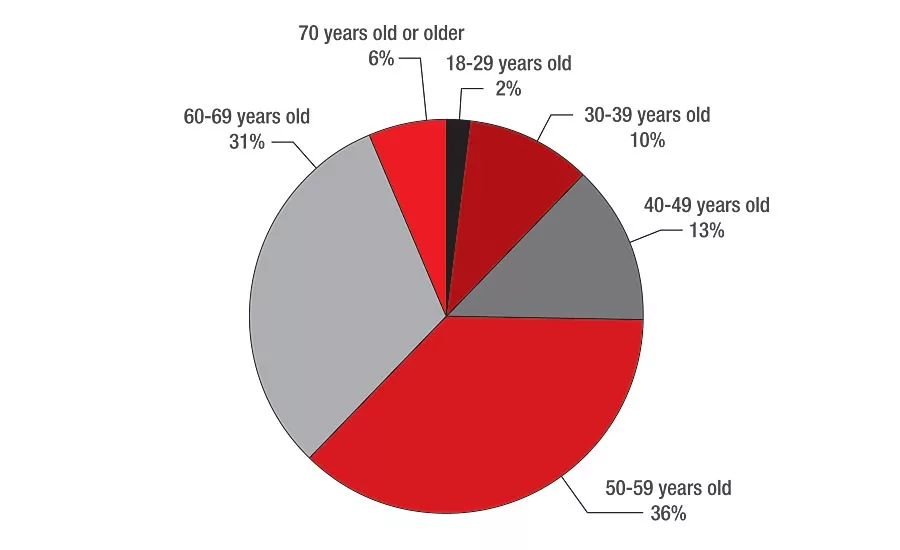
The majority of respondents are male (86%), with an average age of 55.
Thirty-six percent of respondents said quality management was their primary job function, followed by quality engineering at 21%. Corporate management, engineering, and management operations/production/supply chain management each was listed by 8% of respondents. Manufacturing engineering was cited by 6%, followed by research and development at 4%. One percent said their primary job function was purchasing.
The respondents were an experienced group. Forty-one percent of respondents have been in the industry for more than 25 years. The mean was 23 years.
They’ve switched companies along the way, with more than two-thirds employed at their current company for 15 years or less. The mean was 12 years.
Along with this experience comes supervisory responsibilities. Almost two-thirds (62%) have a supervisor role, and of these, 51% supervise less than five people.
Working more than 46 hours per week is the norm for 43% of respondents. About half (52%) work between 40-45 hours per week, 27% work 46-50 hours, and 16% work more than 50 hours. Only 5% said they work less than 40 hours. The mean was 46 hours.
The hours worked have not changed in the past twelve months for 76% of respondents. They have increased for 19%, by an average of seven hours. For the 6% who said their hours have decreased, this was by an average of 13 hours.
Respondents anticipate these numbers to look similar next year. Seventy percent said they expect to work the same number of hours in the next 12 months, 23% expect an increase, and only 7% expect a decrease.
These work hours are likely very busy, as the list of quality-related responsibilities is long. Implementing solutions to problems, interfacing with management, and documenting adherence to formal standards (such as ISO) were the top three listed. Other primary responsibilities included interacting with customers and suppliers, continuing education and training, implementing quality methodologies, and researching new technologies. Respondents also cited supervising day-to-day operations, increasing productivity, evaluating supplier proposals and reviewing budgets.
In between all of these responsibilities, there are some job constraints that threaten to get in the way. Time constraints were expected to be the biggest barrier in the next twelve months, followed by the skilled labor shortage. Budget cutbacks, management support, and new and existing standards rounded out the top five.
Despite these obstacles, more than half (55%) of respondents say they are extremely satisfied with their jobs. Only 8% said they are not at all satisfied.
The most important factor at work was a feeling of accomplishment, followed by a good work relationship with colleagues. Salary came in third, followed by job security, technical challenges, ability to try new approaches, a pleasant work environment and a chance to be a team leader.
Job concerns were: improving skills of the workforce, management support, economic conditions, sufficient operating budget, keeping current on technology and regulations, salary, job security, company mergers or acquisitions, and outsourcing or privatization.
Salary & Benefits
Since salary is a factor, let’s take a closer look. Fifty-seven percent of respondents draw an annual salary between $50,000 and less than $100,000. The mean salary was $82,680. Of the more than half of respondents who receive an annual bonus, the average amount is $9,775. These numbers are similar to our 2016 survey results, with the average salary about $2,000 higher, but with a lower bonus.
Forty-eight percent of respondents reported a salary increase, and about 46% said their salary did not change. Only 6% saw a decrease this year. Of those who reported a salary increase, the mean percent increase was about 5%. For those who saw a decrease, the mean percent decrease was 16%.
Economic conditions were the reason for the constant salary, according to 42% of respondents. Company performance, followed by an individual’s performance review, are believed to be the biggest factors influencing salary.
Of course, salary is not the only factor in terms of compensation. Company-paid benefits include health insurance and paid vacation for 84% of respondents. This is followed by dental insurance, 401(k) matching, life insurance, and vision insurance as top benefits. Other benefits cited include tuition reimbursement, flexible hours, on-the-job training, profit sharing, pension, stock purchase plan, and childcare. Only 6% said they did not receive any of the above.
Training is common for respondents, as 74% said they had taken at least one type of training in the past 12 months. ISO, FDA and other regulatory standards were the most common. Half of respondents said they would like to develop their technical skills, while 45% plan to obtain certifications in the year ahead.
Methodology
The online survey was sent to a random sample of the domestic subscribers of Quality. Those who completed the survey were entered into a sweepstakes to win one of three $100 gift cards. The survey was fielded April 5-19. Two hundred and eighty-six people completed the survey. Thank you to all those who completed this year’s survey.
Looking for a reprint of this article?
From high-res PDFs to custom plaques, order your copy today!


