Smart Data Collection is Required for Continuously Improving Your Production Process
More data is not always better.
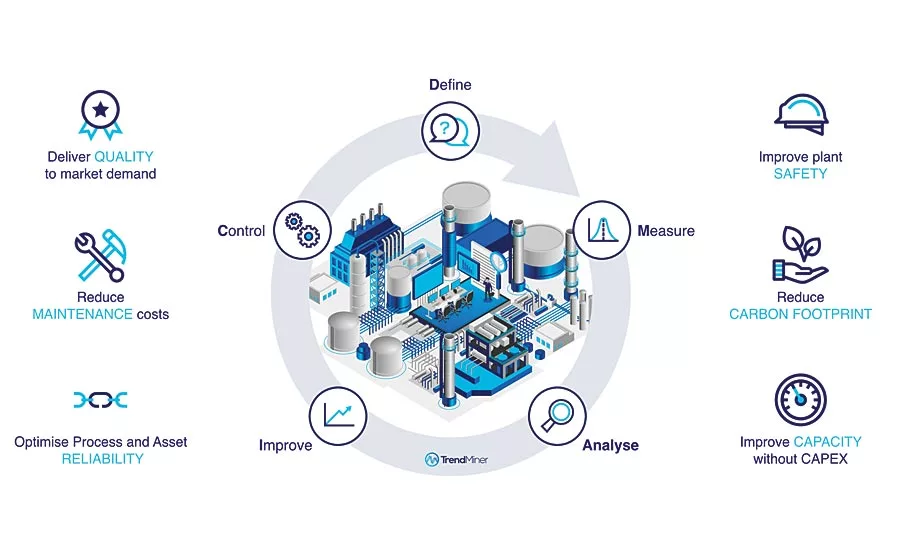
Benefits of self-service analytics used in DMAIC approach.
For process manufacturing companies, it is a constant challenge to meet their customer’s product quality specifications, while operating as lean as possible. The latest trend is to use big data analytics, artificial intelligence and machine learning to improve the production process. But for companies who have made the first steps on their path to digitalization, more data is not always better. A smart approach in gathering and using sensor-generated data is needed to continuously improve the production process while maximizing profitability.
Data Is Being Collected For Years Now
SCADA systems are being used for decades now and were originally designed to collect data and monitor production processes. Since they generate such enormous amounts of data, historians were added to store this data. Initially, historians were used to fulfill regulatory requirements, such as generating reports for government agencies. Leading industrial companies recognized the data hidden in their historians could provide valuable information on plant processes and production, but accessing and utilizing the data could be very difficult. The reason for this is historians weren’t designed for “read” purposes or a two-way transfer of information.
Manufacturing execution systems (MES) were introduced in the early 1990s in an attempt to bridge the gap between plant floor SCADA systems and enterprise ERP software. They also promised to provide analytics, such as KPI data, to improve plant floor operations. While they have been able to provide more advanced capabilities than SCADA systems, they are expensive and often require extensive engineering to be implemented. Moreover, they were developed for a different business era in which systems were still largely silo-ed and internet optimization was largely an afterthought.
Self-service analytics using pattern recognition
Smart Collection & Smart Usage
To improve process performance and overall efficiency, a level of operational intelligence and understanding of data is required. One of the basic elements is that process engineers and other stakeholders must be able to search time series data over a specific timeline and visualize all related plant events quickly and efficiently. This includes the time series data generated by the process control systems, lab systems, and other plant systems and the usual annotations and observations made by operators and engineers.
“There is an immediate need to be able to search time-series data and analyze these data in context with the annotations made by both engineers and operators to be able to make faster, higher quality process decisions. If users want to predict process degradation or an asset or equipment failure, they need to look beyond time series and historian data tools and be able to search, learn by experimentation, and detect patterns in the vast pool of data that already exists in their plant.” - Peter Reynolds, senior consultant at ARC Advisory Group
The advancement of computing over the last 20 years makes it possible to take advantage of computational statistics on readily available hardware. In short, computing power and data processing technology has caught up to the point where statistical learning methods can be readily applied to large data sets in a reasonable amount of time using a modern computer. This gives new ways to optimize operational performance and prevent quality problems. For subject matter experts, such as process and asset engineers, visual inspection of graphically represented time-series data gives the fastest insights in good and bad process behavior. With today’s computer power, usage of pattern recognition and advanced analytics methods, the subject matter experts themselves can quickly find root causes for process anomalies or monitor good process behavior.
How to Use Self-service Analytics for Continuous Improvement?
Self-service industrial analytics combines the necessary elements to visualize a process historian’s time-series data, overlay similarly matched historical patterns, and enrich these with context data captured by engineers and operators. Furthermore, unlike traditional approaches, performing this analysis doesn’t require the skill set of a data scientist or black belt expertise since the user is always presented with easy-to-interpret results.
Six Sigma projects typically follow a methodology inspired by Deming’s Plan-Do-Check-Act Cycle, consisting of five phases: Define, Measure, Analyze, Improve and Control, also known as the DMAIC cycle. Self-service industrial analytics is perfectly suited for supporting each phase of the DMAIC cycle. Empowering subject matter experts with advanced analytics tools enables them to contribute to the operational excellence goals, whether a project is smaller in scope or has a more long-term focus.
Practical Example: Control Quality by Avoiding Temperature Upsets in Reactor
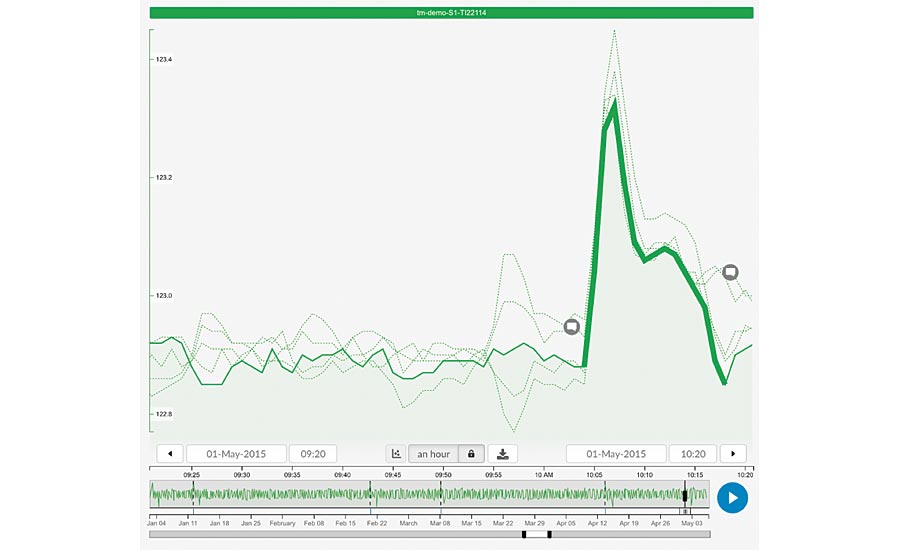
To avoid product quality issues, the temperature in a chemical reactor has to be controlled tightly. The operators noticed an unexpected temperature peak between 10:20 and 11:20 a.m. An analysis is started to identify if this is a one-time incident or if it happened before. Furthermore, the goal is to find a root cause to avoid the temperature upset in the future and control or even improve product quality.
Search for similar behavior
DEFINE PHASE (DMAIC)
The main goal of the Define phase is the definition and scoping of the problem, along with a prioritization based on the cause/effect relationship. The first question to answer is: “Which process conditions are representable of my symptom at hand?”
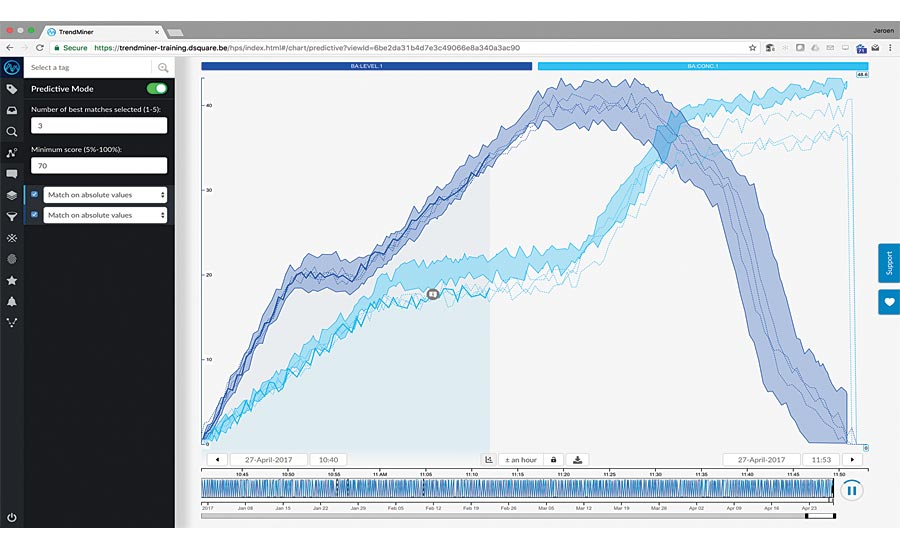
Looking at the trend line of the temperature in the reactor, the process engineer quickly recognizes the normal process conditions and the deviations. To drill down on the issue, graphical search and view tools help allocate the situation. The self-service analytics solution also quickly helps to filter out non-relevant periods, such as maintenance stops, either graphically in the user interface or by using value based search functionalities.
The next step in the Define phase is to check if the situation has happened before. Instead of downloading the data into Excel and building difficult queries, the self-service analytics tool uses pattern recognition to find similar patterns (behavior) in the past. To ensure matches with an equally high temperature increase, this part of the trend line can get a graphical weighing factor. In this case we find multiple occurrences over the past five years for the temperature spike, with a similarity of more than 85%. Apparently, we are not talking about an incident, but a recurring issue that impacts the product quality on a regular basis, giving it a high priority.
MEASURE PHASE (DMAIC)
Now that problem is defined, scoped, and prioritized, a baseline performance as well as objectives need to be established. So instead of looking at the anomaly we now look for good behavior, to confirm the desired results can be achieved. In order to create an accurate baseline, either process expertise is needed or context information needs to be provided to assess similar situations. For example, the process engineer can search for typical temperatures for good behavior, look at daily averages, length of runs that produce acceptable quality, all to confirm that the spikes can be avoided and the project can lead to an improved and controlled process.
ANALYZE PHASE (DMAIC)
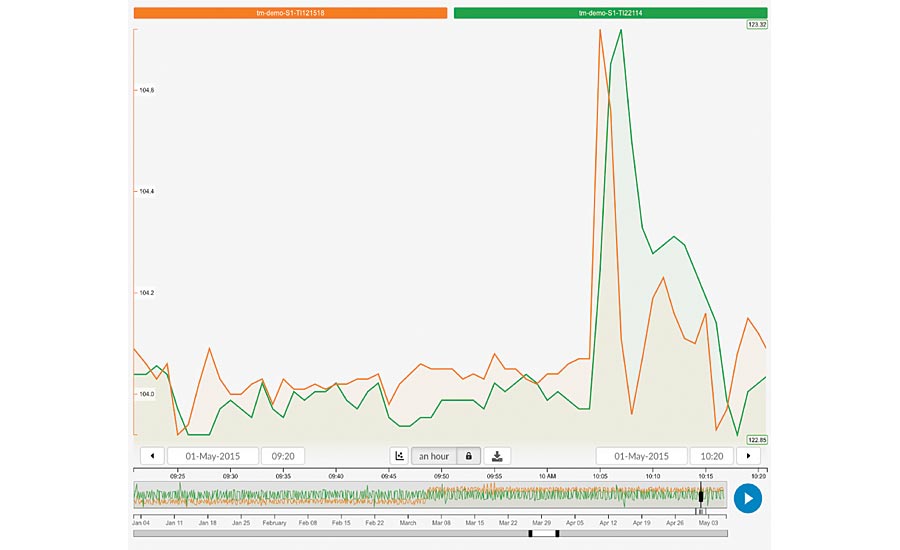
The Analyze phase is all about determining root cause(s) that contribute towards the project’s objective. Looking at the practical example at hand, the user can manually select tags based on process experience (specific sensors with related time-series data in the historian) and then use similarity search to identify if typical upsets in temperature are related to corresponding behavior in the selected tags. Another option is to have the software suggest potential root causes by use of the recommender engine. In both cases the user can find that the temperature of the cooling water shows a peak right before the peak of the reactor temperature which is a clear indicator that this might be the cause of our issue. Automatic time shift detection indicates a one minute shift between the cooling water temperature spike and the upset in the reactor temperature.
Again, by using the similarity search options, now including both tags, it can be verified if this specific situation (a spike in cooling water temperature resulting in a reactor temperature peak) happened before to further confirm the hypothesis. Emphasis can be given to the spike in the trend line, and a minimum matching score can be entered. This will result in a range of search results that support the hypothesis. The root cause found: cooling water temperature spikes due to maintenance which causes the reactor temperature to spike as well.
IMPROVE PHASE (DMAIC)
During the Improve phase focus is put on testing and confirming a solution. In the process industry, this is usually done while production is running. The analytic needs, arising from this phase, are concentrated in online data monitoring, while optionally enabling a comparison against a stored baseline performance. This means that a well-suited self-service industrial analytics platform should offer straightforward creation of real-time performance monitors, where the stored baseline can be utilized if needed. This enables various stakeholder(s) to check if the performed process change yields the desired results, which means the Control phase can begin.
A solution to the problem at hand could be to implement a feed forward controller to monitor the cooling water temperature and adjust the flow to the reactor jacket whenever it detects an upset. Once the controller is in place, a self-service analytics tool can be used to check the impact of the solution: is the temperature more stable; do we see fewer upsets than before? By overlaying periods before and after the implementation, the comparison can not only be made graphically, but statistical parameters (mean, standard deviation, maximum reactor temperature) can be calculated and compared as well.
CONTROL PHASE (DMAIC)
In the Control phase, the benefits of a successful project can be reaped for years to come on both local and global scales. The analytics needs in this phase are similar to the Improve phase, which would be online data monitoring including a baseline if needed. An additional need in this phase is the ability to monitor against signatures of early indicators that have been identified in the Analyze phase, so that not just an early detection is ensured, but preventive warnings are issued. This leads to avoidance of the upset and is of greatest value to the organization. A self-service industrial analytics solution needs to provide the ability to mark signature patterns available for real-time monitoring. This builds a great foundation for following through on any gained insights based on low thresholds of adoption and common trust in the results obtained.
To ensure continued working of the implemented controller, the process engineer can set up a monitor based on the multivariate similarity search (combination of cooling water and reactor temperature spikes). Whenever this situation occurs again, it means the controller is switched off and action can be taken to switch it back on to avoid further upsets.
Root cause
Benefits & Conclusion
Using self-service industrial analytics to support the DMAIC cycle can result in various organizational benefits. By avoiding the need for high statistical expertise, many more people such as process, asset and field experts can start contributing to continuous improvement projects. It might even become fun to work on those structured improvement projects and help people get more quickly certified as green or black belts. Because of this, executives responsible for operational excellence can change the organization’s culture and meet their certification targets much faster.
Furthermore, using self-service analytics can result in more projects being executed per year, bringing faster results in areas such as reducing carbon footprint, quality improvement and reducing waste. The contributing subject matter experts will proactively be generating new insights with use of the extensive capabilities of a self-service industrial analytics platform. Finally, the improvements achieved for one asset, production line or plant can be shared across the organization, improving operational excellence within the entire business unit or fleet. Q
Looking for a reprint of this article?
From high-res PDFs to custom plaques, order your copy today!


