3 Key Benefits of High-Performance SPC for Quality Engineers
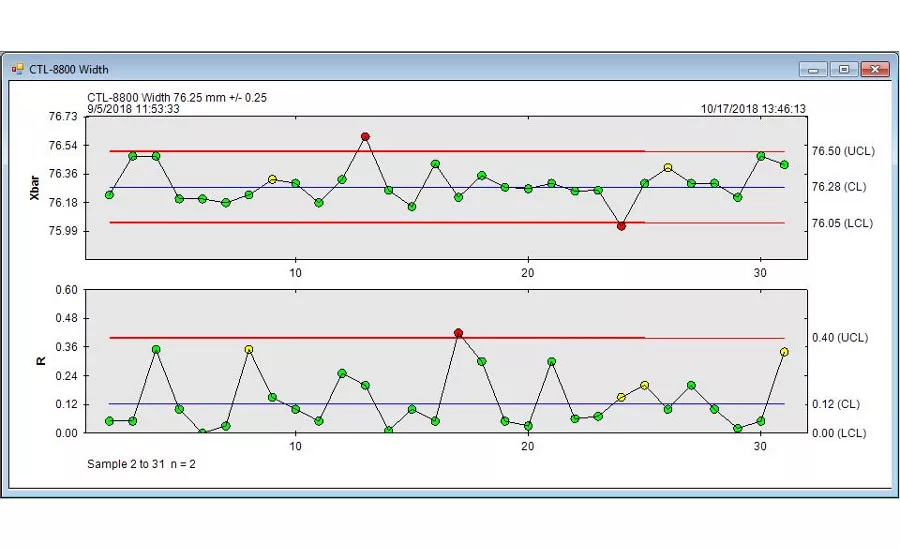
Information-rich Synergy 2000 control charts show real-time process data letting you visualize product quality and predict failures before they occur.
Source: Zontec SynergySPC
Quality engineers use statistical process control (SPC) to eliminate process variation and ensure that final products meet customer expectations. Their job includes rooting out problems during production and ideally preventing issues before products become rejects.
Here are three ways in which high-performance SPC can make this aspect of quality engineers’ jobs much easier.
Automatic Data Collection
When Jeff King began his career in the late 1990s, he used pencils and paper to manually plot data on run charts and plug it into Excel spreadsheets. “It was very labor-intensive and very cumbersome,” King recalls. “Easy to make mistakes, easy not to catch mistakes once they were made.”
Today, King is the quality assurance engineer at Fischbach USA in Elizabethtown, KY, a manufacturer of cartridges and machine systems for the adhesives and sealants industries.
“We don’t do run charts manually here at all,” King says. Instead, the company uses Zontec’s Synergy 2000 SPC software for automatic data collection and reporting. “The data that we collect generates those charts for us,” King explains. Not only that: “They’re more accurate. They’re easy to read. They’re not sloppy.”
To his relief, King found SynergySPC easy to use and intuitive for day-to-day production monitoring and making queries. Simply collect the data via the software first, King advises, and then you can decide exactly how you want to analyze it.
“It’s just matter of going in and setting up variables—by mold, by cavity, by part number,” King says. “The data is always there in the databases waiting for me to decide how I want to look at it and what I want to look at. This is invaluable from my perspective, because it could tell me if I have a catastrophic failure in the design all the way down to a particular mold having a bad day in one cavity.”
Obviously, this is a much more productive use of King’s time than how he used to spend his workdays about 20 years ago.
“I probably spent 60 percent of my day, every single day, gathering forms, making charts, inputting data, and getting the data ready to look at,” King remembers. “Now, I come in the morning, turn my computer on, get a cup of coffee, and by the time I sit back down, I can start looking at and analyzing the data.”
“It’s not if the data is ready for analysis,” King clarifies. “It’s already there, waiting for me to tell it how I want to look at it. And the beautiful part about that is there are so many different ways to analyze the data.”
Issue Prevention
Fischbach is a 24/7 operation, and parts are measured from production two to three times per shift, depending on the importance of the part. On days when King has a new product coming in, he sets up databases for his quality technicians to use on a daily basis for ongoing production monitoring. That data is stored in the Synergy 2000 software; King takes the data and puts it into graphical form.
Through those graphical representations, King says, “I’ll look at every mold and every cavity, look for trends and development in those cavities, and then use that data to go after dimensional issues—hopefully before they become rejects.”
Fischbach produces cartridges for caulk tubes, and King has used SynergySPC to see problems with the cartridges developing before they reach completion: like a mold that has two cavities growing quicker than its other six cavities. “We use the data that the software generates to do proactive tool corrections before they become rejects,” King confirms.
Another advantage of the software for King as a quality engineer is being able to use the graphs to show his quality team exactly what he’s seeing. For example, he can set up a trend graph with the data, relative to upper and lower spec limits, so the quality techs can see what looks off—“and that’ll give them an indication to give me a call next time and say, ‘Hey, there’s something going on in mold 6; these two cavities are starting to grow a bit quicker, or shrink a bit quicker,’” King explains. “You can actually see trends developing before the parts run in the red.”
Mainly, King says that he and his team use X-bar and R charts for range and averages. “These can tell you if you have a screw issue going on in the back of your press, or some kind of accumulator issue going on in hydraulics,” he continues. “We can actually use data that’s going out of the norm to start looking at mechanical variables on our equipment—to say, ‘Maybe there’s something happening on this press that we’re not used to seeing. Let’s take a closer look at that.’” In this way, King says he and his team have predicted failures on presses before they actually occurred.
Comprehensive Traceability
On a regular basis, customers will call King to ask about a product they ordered a week, a month, or even a year ago. What King appreciates about the SynergySPC software is that he can accurately trace a customer’s product from a work order to the actual data from a specific day—and press, mold, or cavity—to tell them with confidence if there was an issue with that product during production or not.
“I find [SynergySPC] invaluable for the amount of data it stores,” King says. “It’s pretty much infinite.” He also can break the data down to any date range he wants to see. For example: “Show me this product forever. Show me this product for the last month. Show me this product from one year ago.”
“To me, that’s the real value of the system: the actual longevity of the data and the ability to break it down,” King says. “I can look into the most minute detail for almost any issue that’s ever popped up.”
Looking for a reprint of this article?
From high-res PDFs to custom plaques, order your copy today!


")

