NDT Data for Process Control and Monitoring
Most advanced NDT methods have several different options for data output.

Over the last 10 to 15 years, NDT methods have grown smarter and smarter. New methods have been developed and old methods have been improved. Some of today’s NDT is leaps and bounds ahead of where it used to be. These advancements have helped tremendously in manufacturing, repair, and maintenance and the data these tests produce are more visual and easily interpretable. I don’t think anyone can argue that NDT is evolving and that this evolution is still ongoing. The other side of this evolution is increased data creation. Inspections are providing large amounts of data and this in combination with the increasing ease and capacity of digital storage is bringing on a new age of using and linking NDT results from testing and monitoring into a new form of process control.
Process control is defined as “activities involved in ensuring a process is predictable, stable, and consistently operating at the target level of performance with only normal variation.”1
The data used to measure process control has always been obtained from the processes themselves and the NDT yield data has been used as a measure of the target level of performance. This approach has worked to provide some process feedback and trending, but the industry really needs to start using the NDT data as the actual measure of the process and not just as a defect measuring tool.
Computed tomography, digital X-ray, X-ray diffraction, phased array ultrasonics, eddy current array, blue or white light visual, resonance testing and many other NDT methods that produce serial number specific, easily storable, and traceable data. Transitioning this data over from mere pass fail inspection data into process control data is the future of what I call nondestructive testing process control, or NDTPC.
Most advanced NDT methods have several different options for data output. When using the method’s data for NDTPC, all the relevant outputs should be used. Many methods can export .csv or .xlsx files directly and these can then be dropped right into the process control (PC) software your company is using. Many will also output images and contour data that can be very beneficial.
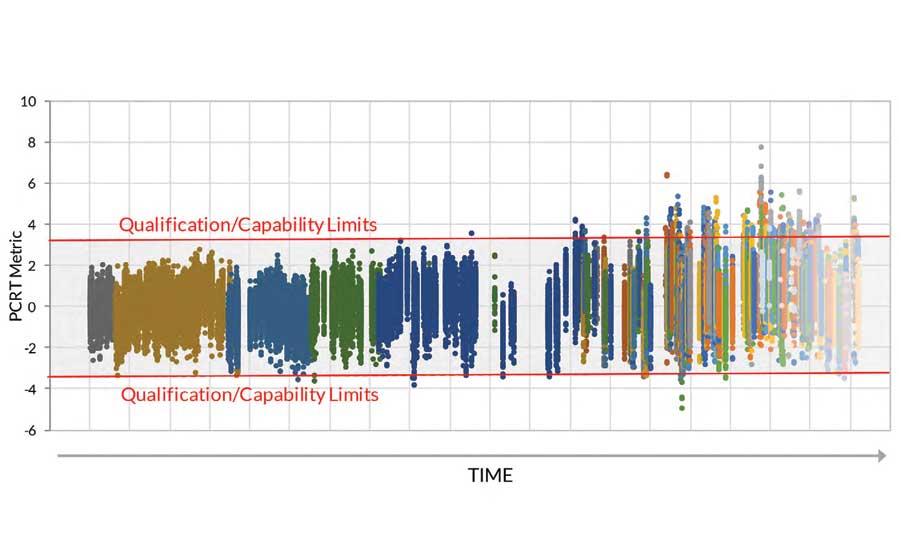
Run chart of PCRT metric for as-cast turbine blades over time. Inspection limits guarantee that blades accepted match characteristics of the initial qualification parts. 2
Nearly all critical parts are tested with sophisticated NDT inspections. These inspections are required and will typically be performed with 100% regularity. The data is already available and ready to be processed. Each method of NDT mentioned above and probably many others can add to the understanding of the processes. Each method can also provide a different perspective on a critical process. These include, but are not limited to, dimensional and material consistency, defect occurrence likeliness, natural frequency consistency, and most importantly, this data can be used for trending these items as well. Accompanying this article are a few plots that highlight the value add of using NDT data for PC.
Clearly, these examples of NDT data being used as a means to compare parts to specific metrics and limits show how NDT data can help to understand process controls and to ensure component conformance.
Processes and individual variables will change and drift over time. This means that the components will inherently carry characteristics of these changes. Things like raw material alloy batching, tool and die wear, thermal processing equipment, recalibration of critical items are sources of these drifts. Many of the advanced NDT methods can provide insight into these changes and if the method data is being exported and tracked for process control purposes, then advanced warning of serious issues can be obtained. Both normal and abnormal components can play a key role in providing a much more quantitative data output of the part stream and this output can be used to feedback into the process and even into the individual process variables. Without these inspection outputs, processes can sometimes quickly get out of control and both the quality and more importantly the functionality of the components can drift into a failing state.
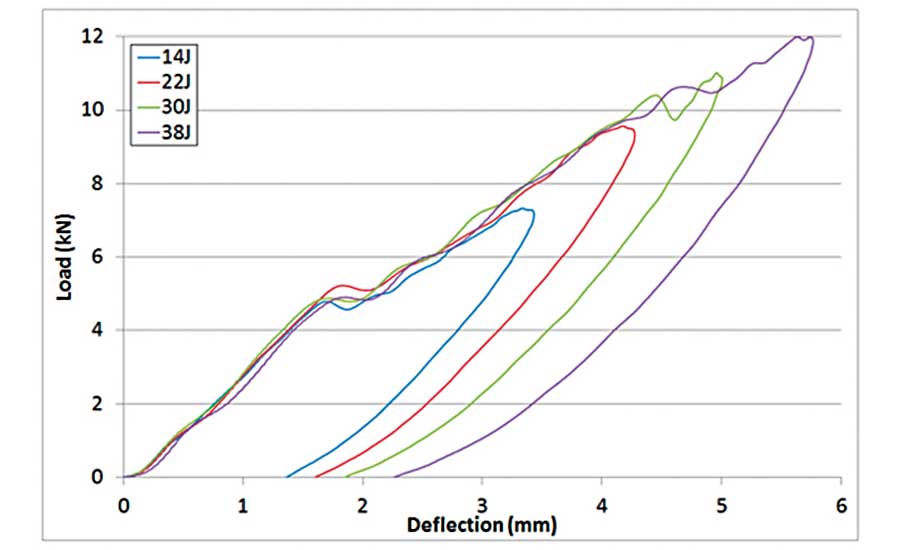
Deflection of impacted panels.3
If you are operating a production facility and you have several required NDT inspections running at 100%, then make sure you use this data for much more than what you are only required to do. Use this information to ensure your processes and products are stable and within specification. As an example, if you are a casting producer and your wax injection tool is wearing due to time and the castings are therefore growing larger, either an X-ray mapping, computed tomography scan, or even just a good old fashioned ultrasonic wall thickness measurement tracking and monitoring can alert you to this issue. Some issues can occur rapidly and others can be brought on by years of wear on tooling or other slow process drifts, but if you are not using your NDT method inspection outputs for process control and monitoring, you may never get to identify the issue until it is too late!
Be outward thinking and start using your NDT data for process control and monitoring.
Sources
Looking for a reprint of this article?
From high-res PDFs to custom plaques, order your copy today!


