This website requires certain cookies to work and uses other cookies to help you have the best experience. By visiting this website, certain cookies have already been set, which you may delete and block. By closing this message or continuing to use our site, you agree to the use of cookies. Visit our updated privacy and cookie policy to learn more.
This Website Uses Cookies By closing this message or continuing to use our site, you agree to our cookie policy. Learn MoreThis website requires certain cookies to work and uses other cookies to help you have the best experience. By visiting this website, certain cookies have already been set, which you may delete and block. By closing this message or continuing to use our site, you agree to the use of cookies. Visit our updated privacy and cookie policy to learn more.
Each new journey begins with a single step. That common proverb applies to most aspects of life, including the decision to start a new business or organization. A company can look back fondly to that first bold and courageous decision to merely begin.
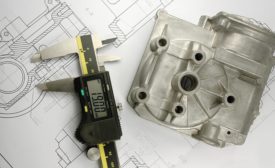
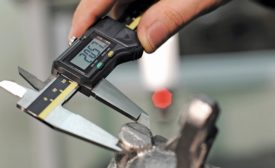
The process of analyzing gage variability is often highly structured, involving an examination of the gages themselves for sensitivity to temperature changes, magnetic fields, and other factors. These are the easy ones. The second area of variability has its source in gage operators themselves, who may have different levels of training, experience, fatigue, and even attitude.
While process improvement initiatives, including SPC and its use of control charts, sometimes get the greatest attention in manufacturing environments, the backbone of a quality improvement effort is often the quiet, unnoticed measurement devices that represent an organization’s commitment to consistency and accuracy.
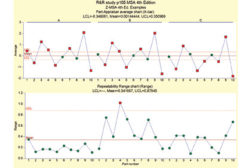
You have just finished your R&R study. Everything has gone according to plan and you are feeling quite pleased. Yet there is something off, something wrong. Your R&R percentage is too high. Now what?