Brain Teaser: Critical to Quality Characteristics
Anyone who has faced a production problem with a need to solve the problem by using production data can relate to the notion of a brain teaser. The brain teasers presented here are based on real-world situations that are encountered by workers in manufacturing environments. The brain teasers have three parts: (1) the situation, (2) available data or other supporting information and (3) questions that various workers want answered for continual improvement. Recommended solutions follow in the next issue and on the Web at Quality Online (www.qualitymag.com).

Situation
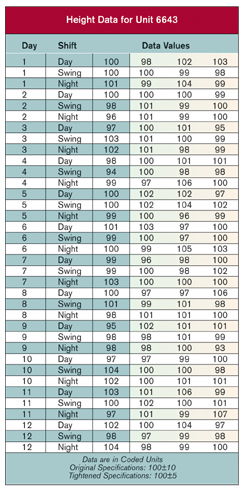
A manufacturer of electrical components has one production line devoted to a high-volume product, Unit 6643. Grant, the manager for Unit 6643, together with the operators, has maintained a stable process on all three shifts for all critical-to-quality characteristics (CTQs). Some CTQs focus on electrical characteristics, while others focus on physical dimensions related to assembly. Prior to last week, there had been no customer complaints about any CTQ in the past six months. Now Grant has a memo that states one steady customer filed a complaint on Unit 6643. The customer stated that the Cpk for height, which is critical for assembly, has decreased dramatically.
Grant also has another memo that states that the sales manager signed a contract with a new customer and promised to meet much tighter specifications for all CTQs on Unit 6643. The process was meeting the original specifications with a minimum Cpk of 1.5. The Cpk for the tighter specifications for several CTQs, including height, is only 0.8. For the past two weeks, the product has been sorted to meet the tighter specifications for the new customer. All product that falls outside the tighter specifications, plus what is left that is inside the tighter specification, is shipped to other customers. It is these customers who are now complaining. The evidence they present is based on process behavior charts constructed from data on incoming lots of Unit 6643. These charts show a stable process with a higher standard deviation and a lower Cpk. Their data shows the current Ca,pk to be 0.7.
Available Data
Grant reviewed the customer complaints and the production data for all CTQs from the past two weeks of production since the onset of the sorting process. Data for height are given in the table, "Height Data for Unit 6643." Also, data from one customer's complaints are given in the table, "Customer Height Data for Unit 6643 at Incoming Receiving and Inspection."
Questions
1. What is the behavior of the production process for height of Unit 6643?
2. What is the Cpk value for height using the original specifications? Using the tightened specifications?
3. Why does the customer's process behavior chart show an increase in the standard deviation for height?
4. What can Grant do about the situation?
Answers to January Brain Teaser
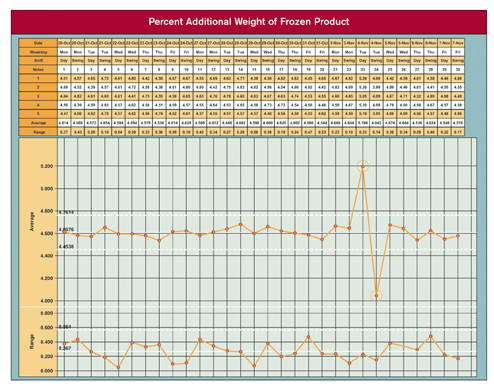
After an unannounced visit to a food company, representatives of a government regulatory agency filed a compliance report citing "significant violations" of the maximum specification for one characteristic. The characteristic in question is the percent of added weight to a premium frozen product after a water bath process, which gives the product a smooth apperance. As quality engineer, Natasha must reconcile her analysis of the data with that of the regulatory agency.
Q: The representatives of the regulatory agency treated the data as one large set and performed their analysis accordingly. Taking this approach, estimate the percent of individual portions that have more than 5% additional weight.
A: Working with all 150 data values as a single set, the average and standard deviation are 4.61% and 0.186% respectively. Currently 5 of the 150 data values are outside the upper specification, or 3.3% of the values. To project what to expect in the future, a common practice is to use the calculated average and standard deviation with a normal distribution to determine the percentage of values that will fall outside specifications. Because the regulators were concerned about values above the upper specification of 5%, they only calculated the area under the normal curve to the right of 5 using an average of 4.61 and standard deviation of 0.186. This gives a projected percent of values outside the upper specification of 1.8 or approximately 2%. This was much too high for compliance with the regulations according to these representatives.
Q: Natasha analyzes the data using a process behavior chart so that she can separate any signals of exceptional variation from the routine variation of the process. What are the results from analyzing the data using a process behavior chart?
A: Because the data were collected in subgroups of size 5, Natasha analyzed the data using an average and range chart. See the graph, "Percent Additional Weight of Frozen Product." This analysis gave the same average of 4.61%. However, the estimated standard deviation based only on routine variation is 0.115%. Using this standard deviation as the basis of control limits, it is easy to see from the range chart that routine variation has remained consistent through the period of time spanned by the data. Also, the values that are above the upper specification limit of 5 are all in one subgroup. The average of this subgroup is outside the upper control limit and is obviously the result of exceptional variation. From this analysis, Natasha focused on finding the cause of the exceptional variation, which turned out to be a faulty thermometer. When it was detected, the operators overcompensated causing the next subgroup average to fall below the lower control limit. Natasha is working on procedures to prevent these causes of variation in the future.
Q: Which analysis gives greater insight into the process? What critical difference exists between the two approaches of analyzing data?
A: The process behavior chart is designed to investigate variation in data by separating exceptional variation from the routine variation of the process. This feature allowed Natasha to see when the exception occurred and find its cause. Using the data as one set and assuming that only routine causes of variation are present does not provide insight into the process.
Q: How should Natasha respond to the report filed by the regulatory agency?
A: Natasha should send her analysis of the data along with the new procedure to prevent this exception in the future. Also, she should show how they use the process behavior chart on a real-time basis to catch exceptions as they occur. This approach will ensure that the current process will meet the requirements of the regulatory agency.
Looking for a reprint of this article?
From high-res PDFs to custom plaques, order your copy today!


