10 Keys for Maximizing the Benefits of your SPC Program
Unleash the power of SPC.
Statistical Process Control is most effective when applied as close to the point of production as possible. Source: DataNet Quality Systems
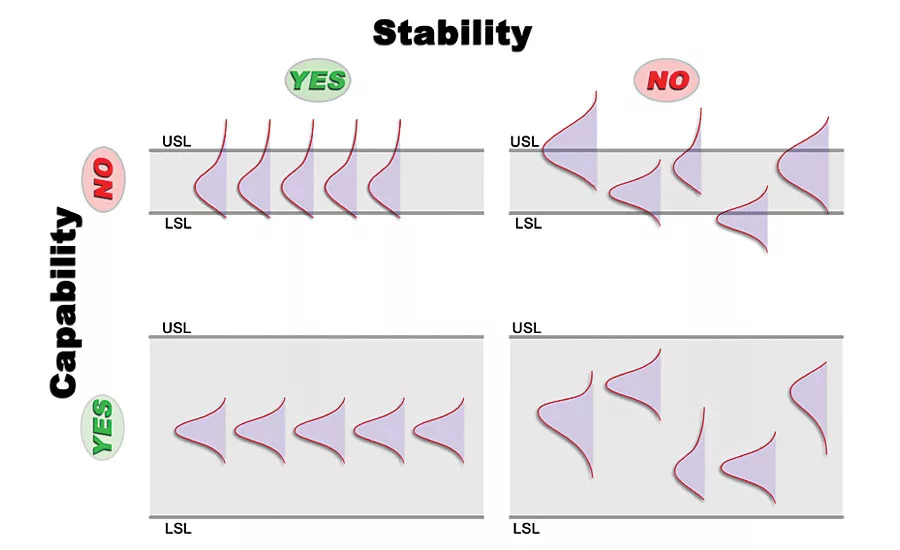
The purpose of SPC is to assess process stability. Once stability is achieved, process capability may be assessed. Source: Integral Concepts
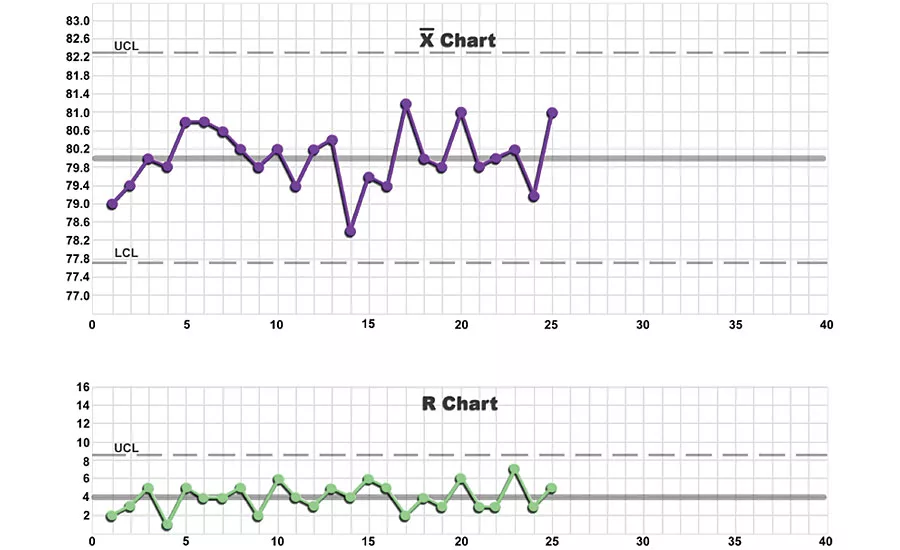
Traditional control charts (e.g. Xbar/R) often fail to accommodate modern manufacturing methods. Source: Integral Concepts
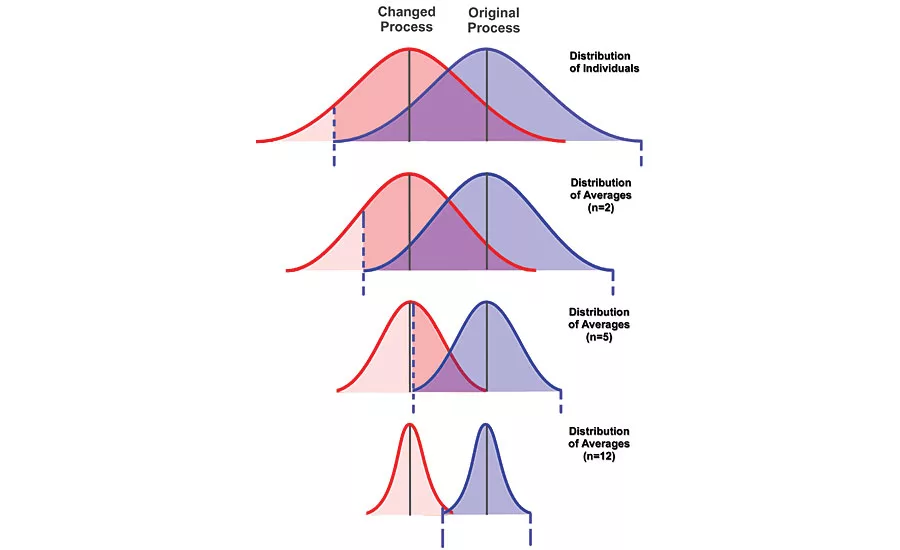
The subgroup size is an important factor in the ability of a control chart to detect process changes. Larger sample sizes allow smaller process changes to be detected. Source: Integral Concepts
Statistical Process Control charts have been called the Voice of the Process. Progressive manufacturers utilize control charts to “listen” to their processes so that potentially harmful changes will be quickly detected and rectified. However, not all SPC programs deliver to their highest capability as there are many elements to get right to achieve maximum utility. Highly effective SPC programs combine technical competencies, such as using an appropriate chart and sample size for the application, with effective management techniques such as enabling operator buy-in and involvement. This article identifies ten keys that unleash the power of SPC.
Tech TipsMisunderstanding the purpose of SPC frequently derails well-intentioned efforts to implement it. Some manufacturing personnel falsely believe that SPC charts are meant to indicate whether products will meet specifications. Rather, SPC charts tell us when the system has changed, so we can quickly identify the causes and potentially prevent an issue or make an improvement. |
Misunderstanding the purpose of SPC frequently derails well-intentioned efforts to implement it. Some manufacturing personnel falsely believe that SPC charts are meant to indicate whether products will meet specifications. Rather, SPC charts tell us when the system has changed, so we can quickly identify the causes and potentially prevent an issue or make an improvement. These can be changes that are still within specification—but are statistically different than where the process was previously running. By identifying the changes, we can identify what caused the change and potentially improve the process or prevent the production of inferior products. Note that the appropriate method to assess whether the products will meet specification consistently is Process Capability Analysis (provided that the process is stable).
2. IDENTIFY AND FOCUS ON THE KEY CHARACTERISTICS
SPC will not add a lot of value if we are controlling the wrong characteristics. Since controlling everything is not feasible or efficient, we must ensure that our efforts are spent on controlling those process characteristics whose variation will impair product performance, quality, and reliability. When the significant process variables that affect a key process output are being controlled, then the process output is predictable, allowing costly inspection systems to be eliminated.
It can be challenging to determine exactly which key process input variables, if controlled, will produce predictable and consistent process outputs. Design of Experiments or regression modeling are efficient and effective methods to understand and model the effect of input variables on key outputs. In order to apply SPC properly, practitioners should take time up front to understand the key process characteristics and the extent to which variation will impact outcomes.
3. VALIDATE MEASUREMENT SYSTEMS
The effective use of data to drive decision making requires adequate measurement systems. When interpreting statistical process control charts, we assume that a signal represents the measurement of a significant change in the process and we react accordingly. However, inadequate measurement systems may result in inappropriate signals or, even worse, charts that fail to detect important process changes. Thus, it is critical to properly assess whether measurement systems are adequate for their intended use prior to their use. Only capable measurement systems should be utilized to support quantitative methods such as Statistical Process Control.
Important measurement system characteristics include discrimination, accuracy, precision (repeatability and reproducibility), linearity, and stability. Techniques exist to assess measurement systems for each of these important characteristics. Skipping such assessments can lead to the use of measurement systems that are not capable of monitoring process variation or, in extreme cases, even of distinguishing between conforming and non-conforming product. In short, validating measurement systems is an important pre-requisite to applying SPC methods.
4. CHOOSE THE RIGHT CHART FOR THE APPLICATION
Choosing the wrong type of chart can impede the goal of correctly diagnosing the presence of special causes of variation on a timely basis. Many factors must be considered when choosing a control chart for a given application:
- The type of data being charted (continuous or attribute)
- The required chart sensitivity (size of the change to be detected)
- Whether the chart includes data from multiple locations (possibly resulting in more than one expected source of variation)
- The ease and cost of sampling
- Production volumes
- The presence and frequency of production changeovers (e.g., short productions runs)
- Whether or not trending is expected (e.g., due to tool wear)
Traditional control charts (e.g., Xbar/R, X/MR) were developed in the 1920s when production systems were far more primitive. Often, these traditional charts are inappropriate at managing and identifying changes that occur in modern day manufacturing systems. Although many newer charting techniques have been developed to accommodate modern manufacturing methods (e.g., Within/Between charts, Cusum charts), their adoption has been spotty at best. In cases where traditional control charts fail to do the job sufficiently, alternative charting techniques are required.
5. UNDERSTAND THE DIFFERENCE BETWEEN CONTROL LIMITS AND SPECIFICATION LIMITS
Control limits represent the range over which we expect statistics, such as process averages or standard deviations, to fall. When these process statistics fall outside the control limits, we conclude that a process change has occurred. On the other hand, specification limits are limits of conformance pertaining to individual values such as a part dimension or material properties. Control limits should only be determined by actual process data whereas specification limits are determined by an engineer, designer, or customer. Manually “assigning” control limits should only be permitted when based upon the process data, otherwise the control chart will result in inappropriate chart signals or a lack of appropriate chart signals. Finally, specification limits do not belong on control charts. Because averages have considerably less variation than individual measurements, they cannot be compared to specification limits which are typically intended to apply to individual measurements.
6. EMPLOY EFFECTIVE SAMPLING STRATEGIES
The manner in which data is collected has a significant impact on the performance of control charts. The goal is to be able to adequately distinguish the signals (special cause sources of variation) from the noise (common cause sources of variation). Control limits should reflect common cause variation only, so that special causes are actually detectable. Sampling schemes should be designed to ensure that special cause sources of variation, if they exist, are not reflected in the control limits.
Traditional control charting methods (such as Xbar and R/S charts) assume that the sampling process produces rational samples. That is, all measurements come from a single distribution. However, many types of production processes do not lend themselves to rational sampling, such as sampling from multiple cavities, filling heads, or spindles, where a statistical difference may exist between the locations. Often, continuous and batch processes also fail to produce rational samples for traditional SPC. Before attempting to use traditional control charts, rational samples must be verified.
If rational samples are not obtained then the control limits will not reflect the desired limits of expected variation. In such case, an alternative sampling strategy or an alternative charting technique must be employed.
7. SELECT THE RIGHT SAMPLE SIZE
Sample size refers to the number of measurements taken within each subgroup. Charts of averages have the ability to vary their sensitivity to detect process changes based upon the sample size. Small sample sizes, such as individuals charts where n=1, lack the power to detect small process changes. On the other hand, excessively large sample sizes can result in control charts that indicate instability even when the process change is not of practical concern.
Many people involved in designing control charts have little understanding of the impact that sample size has on the ability of the chart to detect process changes. The reality is that the sample size can have a dramatic impact on whether signals are obtained for a given process change such as a mean shift. Before we design a chart, we should have some idea of what degree of process change we would want to detect if it occurred. Usually this depends on how much variation we are willing to tolerate and how capable the current process is. For instance, a highly capable process probably won’t need as much sensitivity as a borderline capable process.
Selecting an appropriate sample size allows a control chart to produce signals when we need them and minimize the chance that we’ll be alerted of changes that are of little or no practical significance. Note that the sample size may need to be modified over time to reflect process improvement or process degradation.
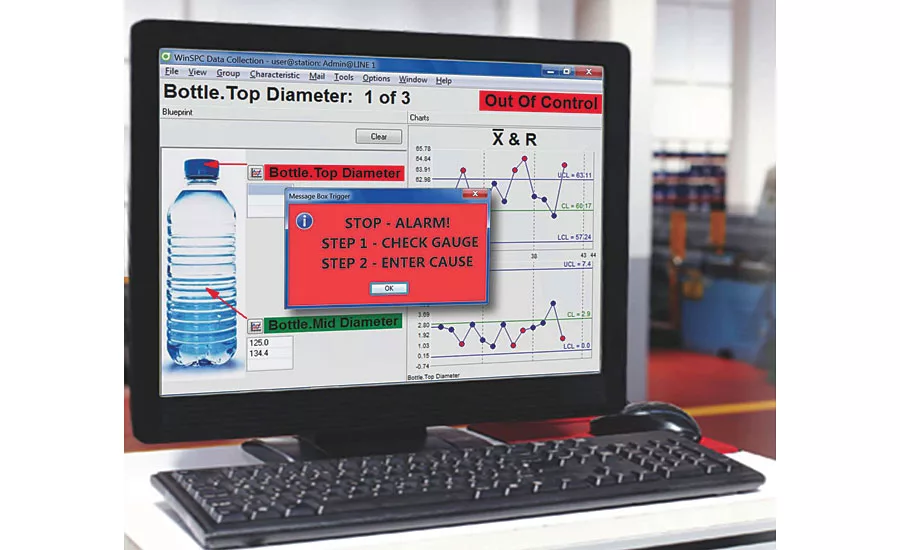
8. AUTOMATE SPC TO REDUCE COST AND IMPROVE PROCESSES
Statistical Process Control is most effective when applied as close to the point of production as possible. If sampling and charting is performed after the end of a run, discovering that the process was not in control after-the-fact may prevent a questionable shipment, but the cost of additional inspection, scrap and/or rework is already generated. With automated, in-line SPC systems, control tests can signal operators of a problem and prompt action to address special cause variation before the manufacture of nonconforming product. By providing real-time feedback, automated SPC systems become preventative, rather than merely reactive, monitoring tools. Automated SPC systems also reduce the opportunity for human transcription error and ensure that control test rules are consistently applied and alarm conditions are recorded for further investigation.
9. EMPOWER OPERATORS TO SEEK IMPROVEMENTS
In some shops, operators are conditioned to view SPC as a stick to make sure they are doing their jobs. If a process goes out of control, the operator is blamed for “not controlling the process.” As a result, operators may frequently tweak (over-control) the process in an attempt to keep it on target. Instead, operators should receive adequate training in how SPC can help them manage the process effectively. They should be empowered to stop the process (when appropriate) and be rewarded for taking actions to identify and remove special cause sources of variation.
Control charts are tools to assist and empower the operators. A little education will go a long way to achieving buy-in and use of the tool as intended.
10. MANAGE THE CHARTING PROCESS AND DRIVE IMPROVEMENTS
When a control chart identifies a change, an appropriate response is for personnel to determine the causes of the change. Instead, when a control chart shows a change, operators or supervisors often try to make an adjustment without knowing what to adjust or how much to adjust. Taking such action without first identifying the cause of the change can actually increase the variation. If we instead resist knee-jerk responses and investigate the source of the change, then something has been learned—and random and potentially harmful adjustments can be avoided.
Effective process control requires discipline in managing the charting process so that reaction plans are followed, systemic issues are identified, and improvements are realized over time. Managing the process involves reacting to chart signals, identifying root causes of process changes and systematically working to eliminate them. It also means knowing when to recalculate control limits and possibly modify sample sizes. Only by managing the charting process can an SPC program fulfill its potential of driving process improvement and product quality. Q
Looking for a reprint of this article?
From high-res PDFs to custom plaques, order your copy today!


