It's All About Growth: Quality's 18th Annual Spending Survey
Quality’s 18th Annual Spending Survey reports budget increases for a range of product categories.
January is not typically considered a season of growth, but Quality’s research reports a lot of it. It’s spending survey season and quality professionals are starting to invest in new equipment.
It’s an optimistic outlook this year, with more positivity reported for quality related items this year versus previous years, according to our 18th Annual Spending Survey.
BNP Media’s market research division, in conjunction with Quality, conducted the study to provide information about spending for capital equipment, software and services. As in the past, the study was conducted in order to determine a plant’s actual spending for quality assurance equipment, systems, software, and services compared to the projected/budgeted amount. We also wanted to assess any change in quality professionals’ approach to quality today compared to a year ago, as well as spending on quality equipment and services overall. Finally, we looked at the change in allocation of budget within quality equipment and service categories.
Demographics
The profile of respondents matches previous years. Assembly is the top manufacturing operation performed at respondents’ locations (72%), followed by drilling and milling. Other operations mentioned included welding, turning, finishing, grinding, forming/fabrication, stamping, injection molding, and gear cutting. Seventeen percent indicated they performed other activities not listed here.
On average, respondents have just under 300 people at their location. The bulk of respondents came from the Midwest (39%), followed by the South (26%), the Northeast (18%), and the West (17%).
A range of products are produced at these locations. Aerospace products were the most common primary end product listed (16%), followed closely by fabricated metal products (13%). Others mentioned were: plastics and rubber products; motor vehicle, body, trailer and parts; miscellaneous manufacturing; medical equipment and supplies; machinery; electrical equipment, appliance and components; primary metal; computer and electronic products; energy industry manufacturing; other transportation equipment; navigation, measuring, electromedical and control instruments; and furniture and fixtures.

Principal Motives for Investment
Just under half of respondents (44%) are in quality management, followed by 17% in quality engineering, 10% in engineering/technical, 8% in corporate management, 8% in manufacturing, 7% in manufacturing engineering, and 2% for both purchasing and research and development.
A Look at Quality
More than half of respondents (58%) indicate that the importance of quality has gone up as compared to a year ago. Forty percent said quality was about the same level of importance and only 2% said it was less important. This is in line with previous results.
The majority of respondents (56%) indicated that they spent the amount they had projected last year. In 2016, an even larger percentage (70%) indicated that their projected spending matched their actual spending.
For the 23% of respondents who said last year’s actual spending was higher than projected, they were over budget by 20% on average. For the 21% who said they were under budget last year, they were under by an average of 21%.
When asked about the current year’s actual spending vs. projected, these results were similar. Three out of five respondents indicated they spent the same in 2017 as they budgeted for. Twenty percent indicated they are spending more than budgeted, on average by 19%. For the 17% of respondents that spent under budget, this was under by an average of 22%.
They are optimistic about future spending as well. Nearly half of respondents (45%) expect an increase for next year’s fiscal budget. For those that expect an increase, on average this is expected to be 18% higher. Only 11% predicted a decrease for next year’s spending, and of those, the average decrease predicted was 31%.
Quality Equipment and Services Planned to Purchase
And now is the time to start the spending process. Two-thirds of respondents indicate they plan to make the first fiscal 2018 purchase in the first quarter of this year, with January listed by 27% as the month to make their first purchase. Some got started earlier and said they would make their first fiscal 2018 purchase before the end of 2017.
Investment and Inspection
The reasons for investment have remained the same. Reducing scrap and rework, improving productivity, and increasing production capacity are the top investment motivations for those that plan to spend more this fiscal year. Other reasons included: to reduce costs, comply with ISO quality systems, ramp up for new product, tighter part quality standards, improve cycle time, regulatory compliance, and enhance machine/process flexibility.
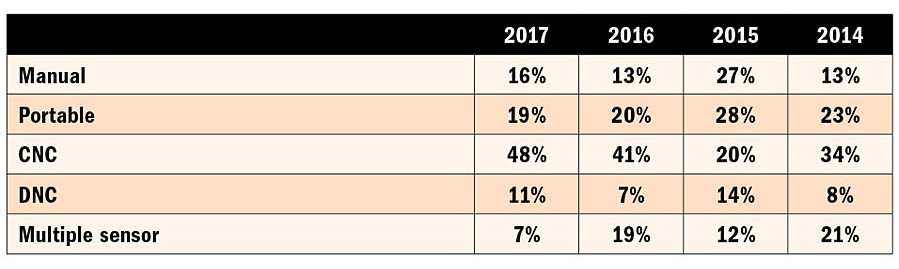
The inspection approach varies between incoming, in-process, and final product, but has stayed consistent for the past four years. The majority of respondents perform lot sampling inspection methods for incoming parts. At the final product stage, the inspection method is split between lot sampling and inspecting every part/product.
Making a List
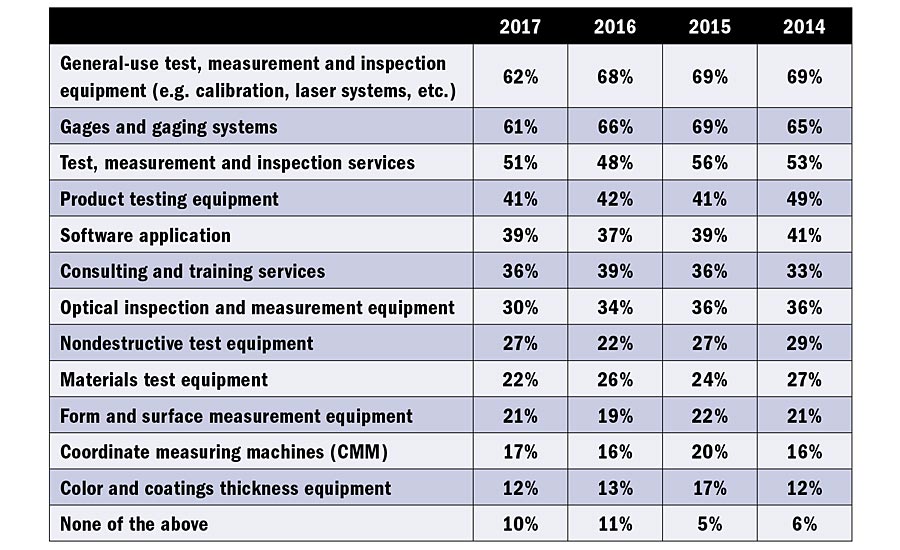
The majority of respondents plan to invest in general-use equipment (62%) and/or gages and gaging systems (61%) this year. But the shopping list is long for quality professionals. They also plan to purchase test, measurement and inspection services; product testing equipment; software; consulting and training services; optical inspection and measurement equipment; nondestructive test equipment; materials test equipment; form and surface measurement equipment; coordinate measuring machines; and color and coatings thickness equipment. Ninety percent of respondents indicated they would purchase something from at least one of these categories.
And now let’s take a closer look at these product categories.
The Budget Explained
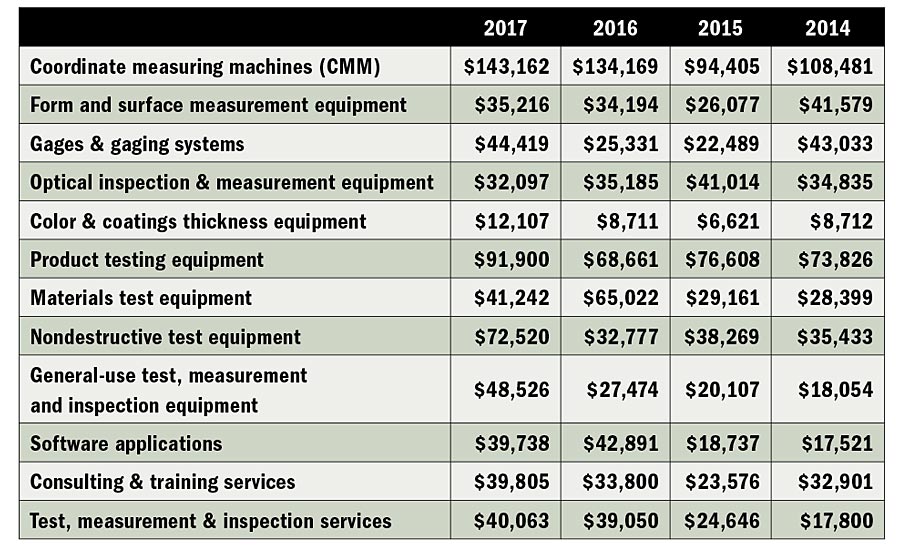
Budgets are on the way up. For many of product categories, these are expected to jump this year. On average, the planned budgets for coordinate measuring machines; gages and gaging systems; product testing equipment; nondestructive testing equipment; consulting and training services; and general use test, measurement and inspection equipment increased compared to 2016 results. In some cases, this was a significant jump as well. Product test equipment went from a planned budget of under $69,000 in 2016 to almost $92,000 in 2017.
Color and coatings thickness equipment saw a jump from $8,711 planned for 2016 to more than $12,000 in 2017. Gages and gaging systems went from about $25,000 in 2016 to $44,419 for 2017. CMMs also jumped from just over $134,000 planned for 2016 to just over $143,000 for 2017.
Average Budget for Fiscal Year 2018
CMM Budget Allocation
What percentage of your total fiscal 2018 coordinate measuring machines (CMM)
budget will be spent on the following machine types?
The general use test, measurement and inspection equipment jumped from about $27,000 in 2016 to more than $48,000 in 2017. Consulting and training services are also up from almost $34,000 in 2016 to almost $40,000 in 2017. And finally, the planned budget for nondestructive test equipment more than doubled. It jumped from almost $33,000 in 2016 to $72,520 for 2017.
Budget Projections
The coordinate measuring machine (CMM) budget seems poised for another increase in spending. Last year was a banner year for CMM spending according to respondents. The average 2017 fiscal year budget for CMMs was $182,505, more than a $100,000 jump from the $80,480 average budget for 2016. Sixty-one percent of respondents predicted an increase for this year as well.
Among the respondents that plan to invest in form and surface measurement equipment, the 2017 budget for these items was higher than 2016—almost $43,000 as compared to just under $33,000. In addition, half of respondents expect it to remain the same for this year. This trend was seen for a range of product categories: rising budgets but the same amount predicted for the following year.
The average 2017 fiscal year budget for gages and gaging equipment nearly doubled compared to last year’s results (more than $41,000 up from almost $23,000), though the majority of respondents expect it to remain the same for the 2018 fiscal year. Just under a third of the gaging budget is planned to be spent on handheld measuring tools.
The optical inspection and measurement equipment budget has held steady, with an average 2017 fiscal year budget reported at $36,525.
The average budget for color and coating thickness equipment is $13,305, though 55% expect a 2018 fiscal year increase.
The average 2017 fiscal year budget for product testing equipment tripled from 2016, jumping to almost $96,000 from roughly $32,000. Despite this jump—or perhaps because of it—about two-thirds of respondents expect it to remain the same for the 2018 fiscal year.
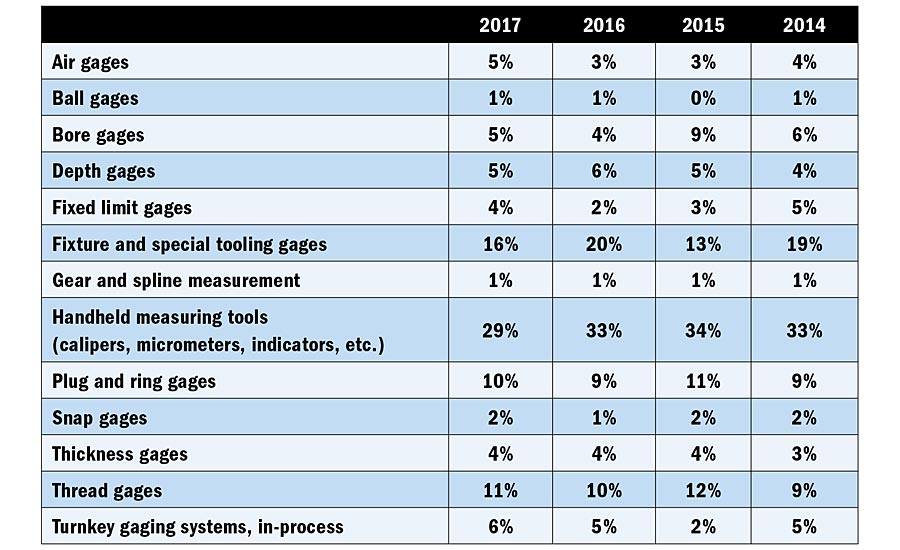
Gaging Budget Allocation
What percentage of your total fiscal 2018 gages and gaging systems budget
will be spent on the following systems?
Materials test equipment also saw an increase in the average budget. The average 2017 fiscal year budget for materials test equipment is $54,626 (up from almost $50,000).
Nondestructive test equipment is also on the up and up. The average 2017 fiscal year budget for nondestructive test equipment jumped to about $73,000, the inverse of the $37,850 from 2016. This marks the second straight year of increased NDT budgets, though once again the majority expect the budget to remain the same next fiscal year. The largest proportion of the 2018 NDT budget expected to go towards ultrasonic test equipment.
General-use test, measurement and inspection equipment climbed from almost $35,000 for 2016 to more than $49,000 in 2017. For the 2018 fiscal year, the bulk of the general-use test, measurement and inspection equipment budget is expected to go towards calibration equipment.
Consulting and training services also saw an increase in average budgets from the 2016 fiscal year to 2017. This is expected to hold steady for 2018 as well. Almost half of this budget is expected to go towards certification/registration.
The average 2017 fiscal year budget for test, measurement and inspection services held steady compared to the previous year and over two-thirds of respondents expect it to remain the same for 2018. More than half of this budget is expected to go towards calibration services.
Software was one of the few categories that reported a lower average for the 2017 fiscal year budget; however, 42% expect this to increase for the 2018 fiscal year. Compared to the past year, respondents anticipate spending more on APQP, ISO 9000 and enterprisewide quality software.
Methodology
The study was sent to a systematic random sample of the domestic subscribers of Quality and fielded October 18 to November 1, 2017. The survey received 282 useable returns, for a 1.5% response rate. Three $100 gift cards were given to three randomly selected respondents who participated in the study.
Thank you to all those who participated in this year’s survey. Our research depends on you and we appreciate all of your help. Q
Please visit www.clearmarkettrends.com to purchase and download the entire report as well as access a wide inventory of other studies done in this industry. You can also email us at [email protected] if you have any questions.
Looking for a reprint of this article?
From high-res PDFs to custom plaques, order your copy today!


