Quality's 20th Annual Spending Survey: Let the Software Spending Begin

Once the gift-giving ends, it’s time for the quality equipment spending to take off. January is typically when quality professionals start filling their quality wish list.
In our 20th Annual Spending Survey, we’ve looked into who will be purchasing what and why. If you subscribe to the idea that no news is good news, the survey offers a lot of promising results for the quality field. For example, twice as many respondents plan to increase their plant’s software application budget in 2020. Stable spending patterns across many equipment categories mean there’s no surprises ahead, but also no cause for alarm.
Clear Seas Research, in conjunction with Quality, has conducted the 20th Annual Spending Study to provide information on the spending for capital equipment, software and services. The study goals were to find out respondents’ plants’ actual spending for quality assurance and control equipment, systems, software, and services compared to the projected/budgeted amount; change in quality professionals’ approach to quality today compared to a year ago; and the change in allocation of budget within quality equipment/service categories.
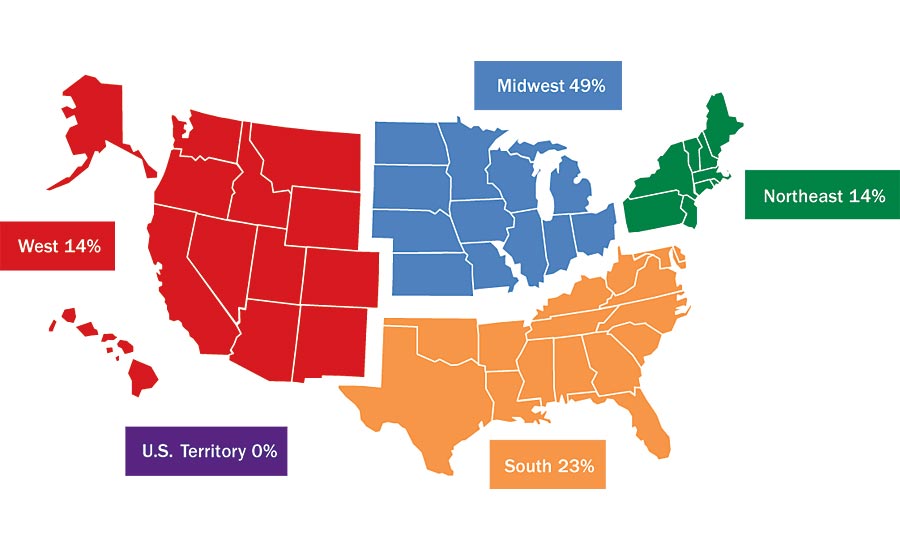
REGION: Where is your facility located?
Manufacturing Operations
The top manufacturing operation performed at respondents’ location is assembly, done at nearly three-quarters of locations. This is followed by machining, performed at almost half of locations.
The job functions vary. The primary job functions of respondents include quality management, quality engineering, and manufacturing management/operations (including supply chain/logistics).
No matter what job function was mentioned, the importance of quality continues to be well understood. The importance of quality has been a stable category for a few years. Half of respondents said the importance has increased at their company in the past year. Just under half say it has remained the same. In other words, with quality as a high priority already, it may be difficult to increase in importance every year.
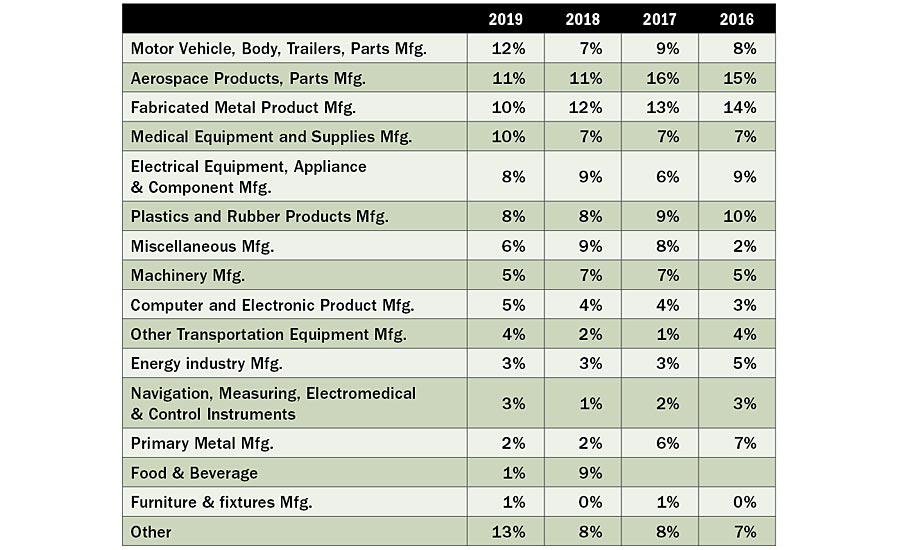
PRIMARY PRODUCTS/SERVICES: Which of the following best describes the primary end product or service performed by your company at this location?
And how are quality professionals doing on their budgeted vs. actual spending? Our survey found that one-in-five respondents’ 2018 actual spending was over budget, on average by 27%. Three out of five respondents state their spending was in line with projections. In addition, when the survey was fielded in October, five-in-seven respondents projected their 2019 spending to be on track with the budget set the year before.
It’s impossible to know the future, but it’s still possible to estimate budgets. According to nearly half of respondents, 2020 spending is expected to remain the same as their 2019 spending. But some do plan to ramp up: just over two-in-five believe their spending will increase—on average by 20%.
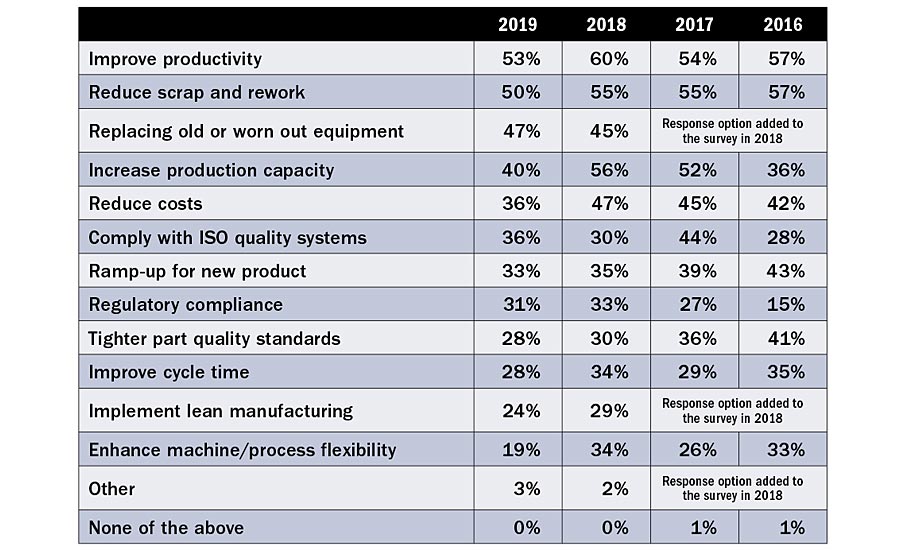
PRINCIPAL INVESTMENT MOTIVES: What are the principal motives behind your fiscal 2020 quality assurance/equipment/services investments?
With all this spending to do, respondents are itching to get started. Almost two-thirds plan to begin making quality assurance purchases in the first quarter of 2020. January is the top month to start spending as 29% plan to begin now. Eleven percent got a jump on fiscal year 2020 spending in 2019. (Perhaps the same people shopping early on Black Friday?) In contrast, only 2% will only begin in October to December of 2020.
There are as many reasons to purchase new equipment as there are quality professionals, but according to those who plan to increase their 2020 quality assurance/equipment/service budget, primary motives include: improving productivity, reducing scrap and rework, and replacing old or worn out equipment. Some reasons have also declined: increasing production capacity and reducing costs seemed less critical to respondents this year. But the reasons for spending on quality are varied. Other motivations are: to comply with ISO quality systems, ramp-up for new product, regulatory compliance, tighter part quality standards, improve cycle time, implement lean manufacturing, enhance machine/process flexibility as well as other reasons not mentioned here (cited by 3%).
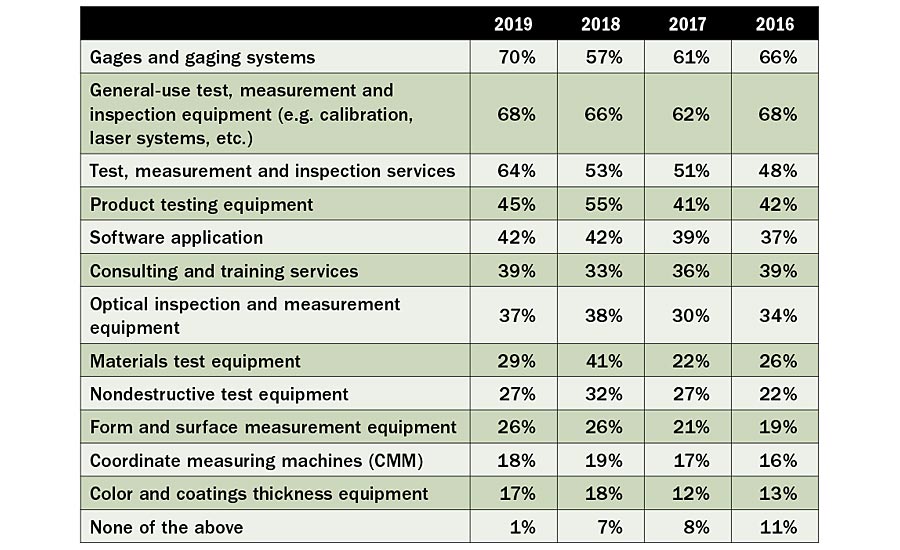
QUALITY EQUIPMENT/SERVICES PLANNED TO PURCHASE: Do you plan to buy the following products/services in fiscal 2020?
If you haven’t drastically changed your approach to inspection, you’re not alone.
The inspection approach remains standard according to respondents. Lot sampling continues to be the most common approach to incoming testing/inspecting (performed by over half of respondents’ companies), over two-in-five companies test or inspect every part or product during final inspections.
What to Spend
It’s time to dig down into the equipment categories. As might be expected, gages top the list. More than half of respondents’ companies plan to purchase gages/gaging systems; general-use test, measurement and inspection equipment; and/or test, measurement, inspection services in fiscal 2020.
Let’s look at the numbers. In terms of form and surface measuring equipment, a third of respondents indicate their company budgeted less than $5,000 for this in 2019 while just under a quarter budgeted $40,000 or more. Spending for 2020 is expected to be similar, which holds true for many categories of our survey. Of this, surface measurement equipment makes up the bulk of the category, with about two-thirds of form and surface measurement equipment budgets projected to be spent on surface measurement equipment in 2020, on average.
No surprises in gaging either. Budgets for gages and gaging systems look similar for 2019 and 2020. Almost three-quarters of respondents are budgeting under $40,000.
For CMMs, the trend looks similar to 2019, though with a larger budget. About half of respondents anticipate their company to spend over $100,000 on CMMs in 2020.
Gages are an ever-present item in the quality field. About 32% of respondents will be purchasing handheld measuring tools in this fiscal year, vs. 29% last year. Respondents will be buying a range of products in this category, including: fixture and special tooling gages, plug and ring gages, thread gages, thickness gages, turnkey gaging systems and in-process, depth gages, bore gages, air gages, fixed limit gages, snap gages, ball gages, and gear and spline measurement. On the whole, the gaging categories have remained consistent with last year, varying by just a percentage point or two at most.
As seen over the past few years, spending on optical inspection and measurement equipment looks positive. Thirty-four percent of respondents plan to increase their optical inspection and measurement equipment budget for 2020; while in 2019 only 27% planned to increase budget.
The color and coatings thickness equipment will hold steady, with nearly half budgeting less than $5,000 for this equipment in 2019.
Good news for product testing equipment manufacturers: A quarter of respondents expect to see an increase in budget allocation for product testing equipment in 2020. Of the 2020 product testing equipment budget, most will go towards environmental testing, leak testing, and/or torque testing equipment.
In terms of next year’s spending on material testing equipment, almost a quarter predict an increase. This category includes tensile testing, hardness testing, chemical analysis/spectroscopy, and force testing.
The nondestructive testing equipment budget is expected to remain the same, according to two-thirds of respondents. Just one in eight expect a decrease in this category. The 2020 NDT equipment budget will star ultrasonic testing, magnetic particle inspection, eddy current testing, and flaw detectors.
How much money are we talking? According to respondents, three-quarters said their company budgeted less than $60,000 for general use test, measurement and inspection equipment in 2019. And, as you may have guessed, this is similar to predicted spending in 2020. Of this general use category, calibration equipment stands out. Data collection devices and laser measurement systems follow.
Software is getting a lot of love from respondents. In looking at survey trends, more than twice as many respondents this year (31% vs. 15% the previous year) expect an increase in 2020 spending for software applications. Top software categories include data collection, document control/management, and calibration software.
Spending on services is also on the rise for a quarter of respondents, though the majority do expect consulting and training service spending in 2020 to be in line with the 2019 budget.
At Your Service
A quarter of the budget for consulting and training services will be spent on certification/registration in 2020, up from 18% in 2018 but down from the 2017 high of 39%. Process improvements (16%) and quality management (14%) account for nearly a third of the budget. Other notable areas are lean manufacturing, failure mode and effects analysis (FMEA), and statistical analysis.
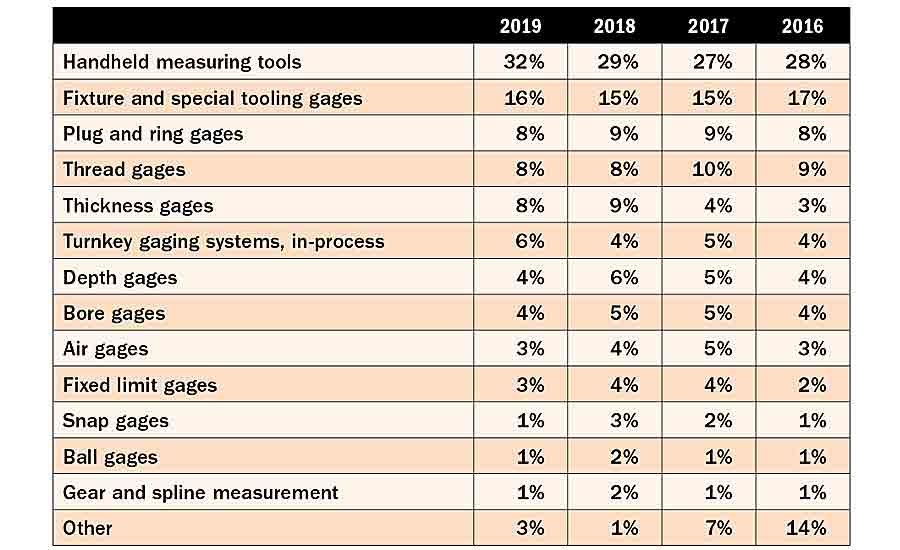
BUDGET ALLOCATION: What percentage of your total fiscal 2020 gages and gaging systems budget will be spent on the following systems?
Calibration service budgets in 2020 have increased significantly since the prior research, accounting for an average of 38% of test, measurement and inspection services, up from 24%. The other top categories include lab testing, materials testing, and contract part inspection and measurement.
Looking to more trending areas, respondents have started adopting new buzzy technologies. More than a third of respondent companies have adopted cloud services/computing, robots, automation/digitization, 3D printing/additive manufacturing and/or wireless sensors. How does your company measure up?
Methodology
The web-based survey was sent to a systematic random sample of domestic subscribers of Quality print, digital edition, and enewsletter, whose primary business is manufacturing and who are familiar with their company’s fiscal quality equipment/services budget for next year. As an incentive, a $10 gift card was offered to all who qualified and completed the survey. The survey was fielded October 14-23, 2019. We received 300 useable returns, for a 1.29% response rate.
Thank you to all those who participated in this year’s survey. We couldn’t do it without you.
The information in this report comes from the 2019 Quality Annual Spending Survey, published in December 2019 in partnership with Clear Seas Research.
Clear Seas Research is a full service, B-to-B market research company. Custom research solutions include brand positioning, new product development, customer experiences and marketing effectiveness solutions. Clear Seas Research offers a broad portfolio of primary syndicated research reports, and powers the leading B-to-B panel for corporate researchers, myCLEARopinion Panel, in the architecture, engineering, construction, food, beverage, manufacturing, packaging, and security industries. Learn more at clearseasresearch.com.
Looking for a reprint of this article?
From high-res PDFs to custom plaques, order your copy today!


