Analyzing and Reporting Tensile Data on Force Measurement Systems
Using readily available tools such as graphs, tolerances, comments, and test criteria ensures that the required tensile information is on hand when needed.
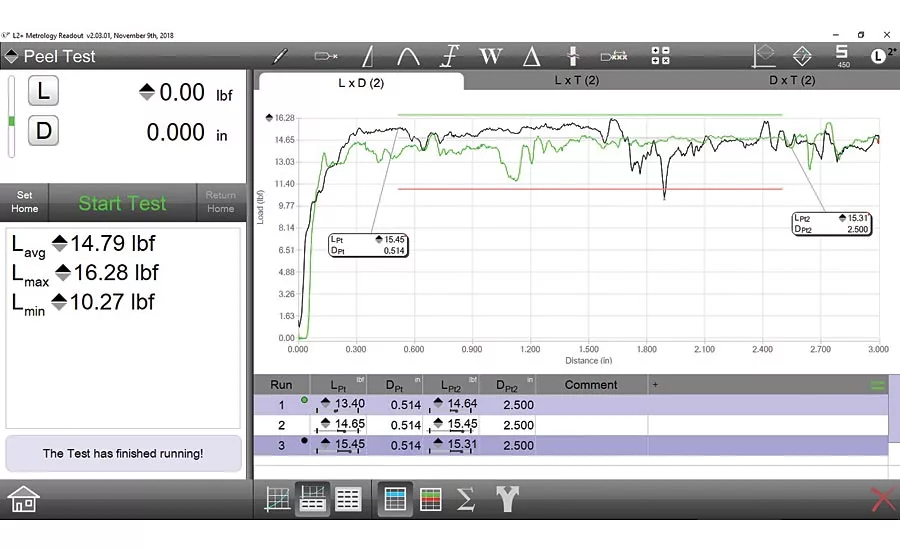
Creating a “tolerance envelope” can help operators quickly identify out-of-tolerance areas in peel or seam testing. The black trace above can be seen dipping below the specified minimum load as represented by the red line. The green trace is shown in tolerance for the specified area. Source: The L.S. Starrett Co.
When testing the properties of a material or component, a range of options are available for examining, reporting and tracking tensile data. In addition to reporting just the most common load and distance data for a tensile test performed on a force or material measurement system, there is more information that can be incorporated to improve traceability, readability, and context to measurements. These might include graphs, tolerances, comments, and test criteria.
A visual comparison of graphical data from a force measurement test can serve as a quick, straightforward tool to compare tests to one another. These visual checks can often help operators identify issues. Many software options have the ability to overlay and recall previously run tests with known good parts that can be used as a reference guide, much like a “golden part.” Expanding on this, some force and material testing software have interactive graphs, so when problem areas are identified they can then be analyzed in greater detail and annotated.
These visual checks are a good aid but can be subjective and vary from operator-to-operator. This variability can be removed by adding tolerances to the data collection portion of the test method. In addition, the tolerances can then be included in reports, so the performance expectations are clearly expressed. When multiple tolerances are used, the result can be reduced to pass/fail in a report summary.
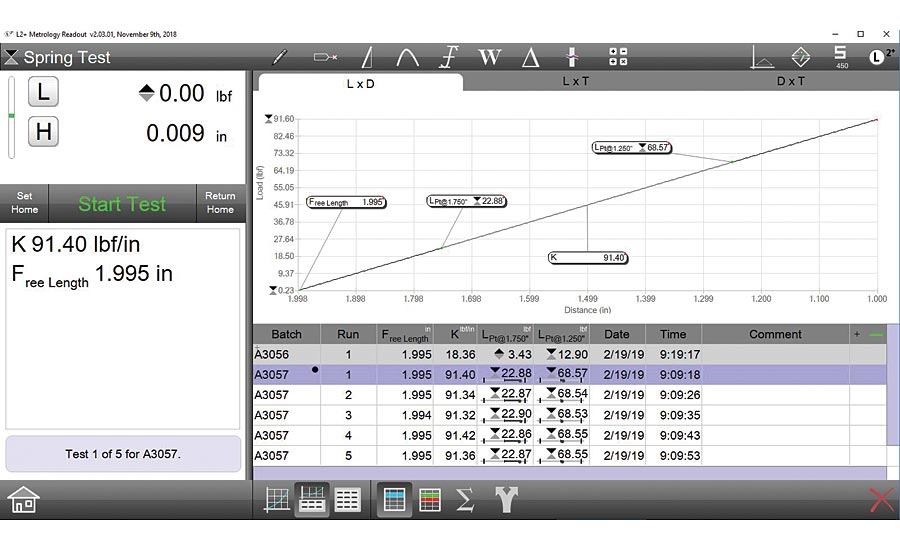
Batching data can help organize testing runs, and notify an operator when they’ve tested a sufficient number of samples in a lot. The above data can be seen organized by Batch, then Run number. When a batch is complete, it collapses and is hidden from view so only relevant data are displayed. Source: The L.S. Starrett Co.
Testing Tolerances
Tolerances are often based on material properties, supplier or customer specifications, or historical data of known good and bad parts. In general, force testing applications have tolerances that are often expressed as a plus or a minus force value (lbf, kgf, N) or distance (in, mm). Spring tolerances differ in that they are commonly expressed in terms of percentage of a nominal value. E.g. 40lbf ±5% at 0.750 inch length.
Applying tolerances to individual points is a common method used. In material measurement applications it is also common to see tolerances on stress (PSI, MPa) or strain (%) values. These tolerance points allow operators in a production environment to quickly determine if a part passes or fails without detailed analysis that might otherwise require quality personnel to interpret the data. For instance, not every operator may know why measurements such as Young’s modulus, yield strength, ultimate tensile strength, or energy are being collected or how these measurements impact the product being tested. However, having tolerances built into the test method creates a flag to notify a member of a quality team when the measurements deviate.
There are also testing scenarios where individual data points are insufficient. For example, when testing welded or stitched seams and adhesives in a 90 or 180 degree peel test, tolerances may be specified for a maximum allowed load or a minimum allowed load over the length of the seam.
A tolerance envelope will ensure the seal remains in the range, where using individual tolerance points risks an out-of-tolerance point being missed. If the graph trace stays within the envelope, the tolerance lines display green, indicating that the measured results are within the envelope. If the graph trace goes outside the envelope at any point, the tolerance line segment displays red. If the data for the results are outside the high limit, the top line segment will display red. If the data for the result are outside the low limit, the bottom line segment will display red.
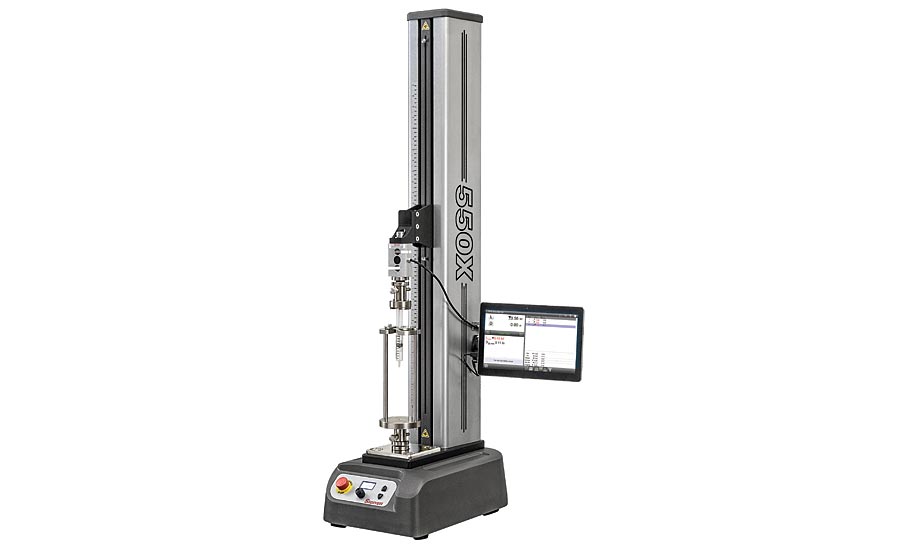
Force testing systems are able to display results in a variety of formats including results view, graph view, data view, tolerance view and statistics view. Source: The L.S. Starrett Co.
Comments and Reports for Traceability
Adding comments after a run is complete is an often overlooked tool. Rather than deleting data and leaving the possibility of future questions regarding the data integrity, comments can be used to explain anomalous results that would skew a batch. Examples of these comments could be:“sample slipped during testing” or “sample broke at grip,” as opposed to breaking-in a controlled area of a dog bone sample.
Life science applications, such as those being used by medical device manufacturers and pharmaceutical manufacturers looking to meet 21 CFR Part 11, may require electronic signatures in their applications and other data protection tools. To be compliant, these operators mark data for deletion but do not actually remove it. For example, when a run is attempted to be deleted it will have a strikethrough, and a comment is automatically added to the data table showing “Deleted by User on [date].” Alternative options like “Delete Last Run” exist as well. When enabled, only the last run of a batch may be deleted.
Further to force and distance data, force and material measurement equipment is designed to measure other information and can automatically export reports for traceability purposes. For example, it is common to include date, time, operator, and batch number. Other information less commonly factored in but extremely valuable nonetheless can help prove the materials were tested as specified such as speed, target distance, target load, number of cycles, sampling rate, and whether a test method is protected against edits.
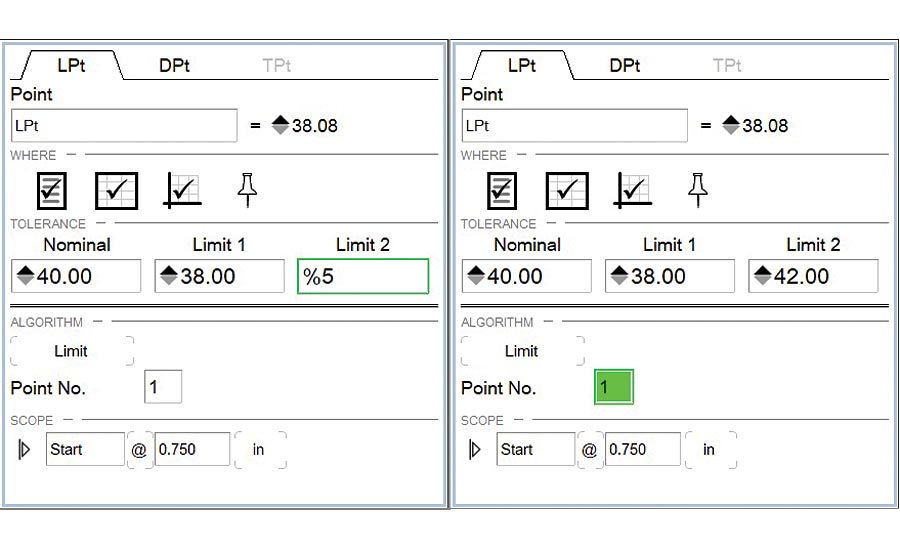
Testing software can aid in converting tolerance % to loads to prevent mathematical or transcription errors by the operator. Source: The L.S. Starrett Co.
Good Management
With so much information available, effectively managing it becomes an important step. Batching data is popular to help aid traceability; the batch number within testing software can directly correspond with a company’s production batch or lot number. Batching data can also aid in finding data in the future for review, and help with report generation.
Many operators also elect to export their data automatically at the completion of a run, most often to a .csv file (comma separated values file) which can be opened in Excel or an SPC program. SPC programs are especially popular because data such as dimensional, weight, hardness, etc. can be integrated into control charts to track trends.
Automatic printing of reports is becoming more common, especially in areas where 100% inspection is required and certificates need to remain with the part that was tested. At the completion of a test, a report is automatically generated and printed—a time-saving measure that adds up throughout the course of a day.
In the long run, taking steps to add context to data and organize it can save significant amounts of time when the inevitable happens and it needs to be reviewed. Using readily available tools such as graphs, tolerances, comments, and test criteria ensures that the required tensile information is on hand when needed for the most productive force measurement and materials testing processes. Q
Looking for a reprint of this article?
From high-res PDFs to custom plaques, order your copy today!


